ServBayでXdebugモジュールを有効化・設定する方法
ServBayはパワフルなローカルWeb開発環境として、PHP開発者向けにXdebugデバッグ&解析ツールをあらかじめ組み込んでいます。Xdebugを有効化することで、PHPアプリケーションの開発効率が大きく向上し、コードのデバッグ・パフォーマンス解析・コードカバレッジ測定が容易になります。本記事では、ServBayでのXdebugの有効化・設定方法を丁寧に解説し、主要な統合開発環境(IDE)との連携手順についても紹介します。
Xdebugモジュールの概要
Xdebugは、PHPコードのデバッグ・プロファイリング用に設計された高機能なPHP拡張モジュールです。ServBayにはXdebugが最初から同梱されており、手作業でのインストールやビルドの手間なく簡単に有効化・設定することができます。
Xdebugの主な機能
- ブレークポイントデバッグ: コードの特定の行で処理を一時停止し、その時点の変数やコールスタックを確認しながらデバッグ可能。
- ステップ実行: コードを1行ずつ(ステップオーバー)、関数内部に入って(ステップイン)、関数から抜け出して(ステップアウト)追跡実行できる。
- 変数ウォッチ: ローカル変数やグローバル変数の値をリアルタイムで確認できる。
- スタックトレース: エラーや例外発生時に詳細な関数呼び出し履歴を表示し、問題の根本原因を即座に特定。
- パフォーマンス解析(プロファイリング): コード実行のパフォーマンスレポートを生成し、ボトルネックを把握。
- コードカバレッジ測定: テストコードが本体コードのどこまでカバーしているか測定し、テストの有効性を評価。
ServBayに標準搭載されたXdebugバージョンとポートマッピング
ServBayはPHP各バージョンごとに対応するXdebugモジュールをあらかじめインストールしています。PHPのバージョンごとにXdebugのリスニングポートが独立して割り当てられているので、IDEでデバッガーを設定する際にはこの点に注意が必要です。
| PHPバージョン | 内蔵Xdebugバージョン | デフォルトXdebugリスニングポート |
|---|---|---|
| PHP 5.6 | Xdebug 2.5.5 | 39056 |
| PHP 7.0 | Xdebug 2.5.5 | 39070 |
| PHP 7.1 | Xdebug 2.5.5 | 39071 |
| PHP 7.2 | Xdebug 3.1.6 | 39072 |
| PHP 7.3 | Xdebug 3.1.6 | 39073 |
| PHP 7.4 | Xdebug 3.1.6 | 39074 |
| PHP 8.0 | Xdebug 3.3.1 | 39080 |
| PHP 8.1 | Xdebug 3.4.0 | 39081 |
| PHP 8.2 | Xdebug 3.4.0 | 39082 |
| PHP 8.3 | Xdebug 3.4.0 | 39083 |
| PHP 8.4 | Xdebug 3.4.0 | 39084 |
| PHP 8.5 | Xdebug 3.4.0 | 39085 |
ポート規則
Xdebugのデフォルトリスニングポートは 39000 + PHPサブバージョン番号 という規則で割り当てられています。例えばPHP 8.3のポートは 39000 + 83 = 39083、PHP 7.4なら 39000 + 74 = 39074 です。この法則を覚えておくと各PHPバージョンで使用するXdebugポートがすぐに分かります。
Xdebugモジュールの有効化方法
ServBayでXdebugを有効化するのはとても簡単です。ServBayのグラフィカルユーザーインターフェース(GUI)からの操作が推奨されますが、手動で設定ファイルを編集することも可能です。
ServBayのGUIでXdebugを有効化する方法
一番手軽でシンプルな手順です。
- ServBayのアプリケーション画面を開く
- 左サイドバーの「言語(Languages)」を選択
- 「PHP」セクションを開き、有効化したいPHPバージョン(例:PHP 8.3)を選択
- そのバージョンの右側にある「拡張」ボタンをクリック
- 表示された拡張リストから「Xdebug」モジュールを探す
- 「Xdebug」左側のスイッチをオフからオンに切り替える
- 必要に応じて各種パラメータを調整
- 画面下部の「保存」ボタンをクリック
- ServBayが自動的にPHPプロセスを再起動し、Xdebugモジュールをロードします
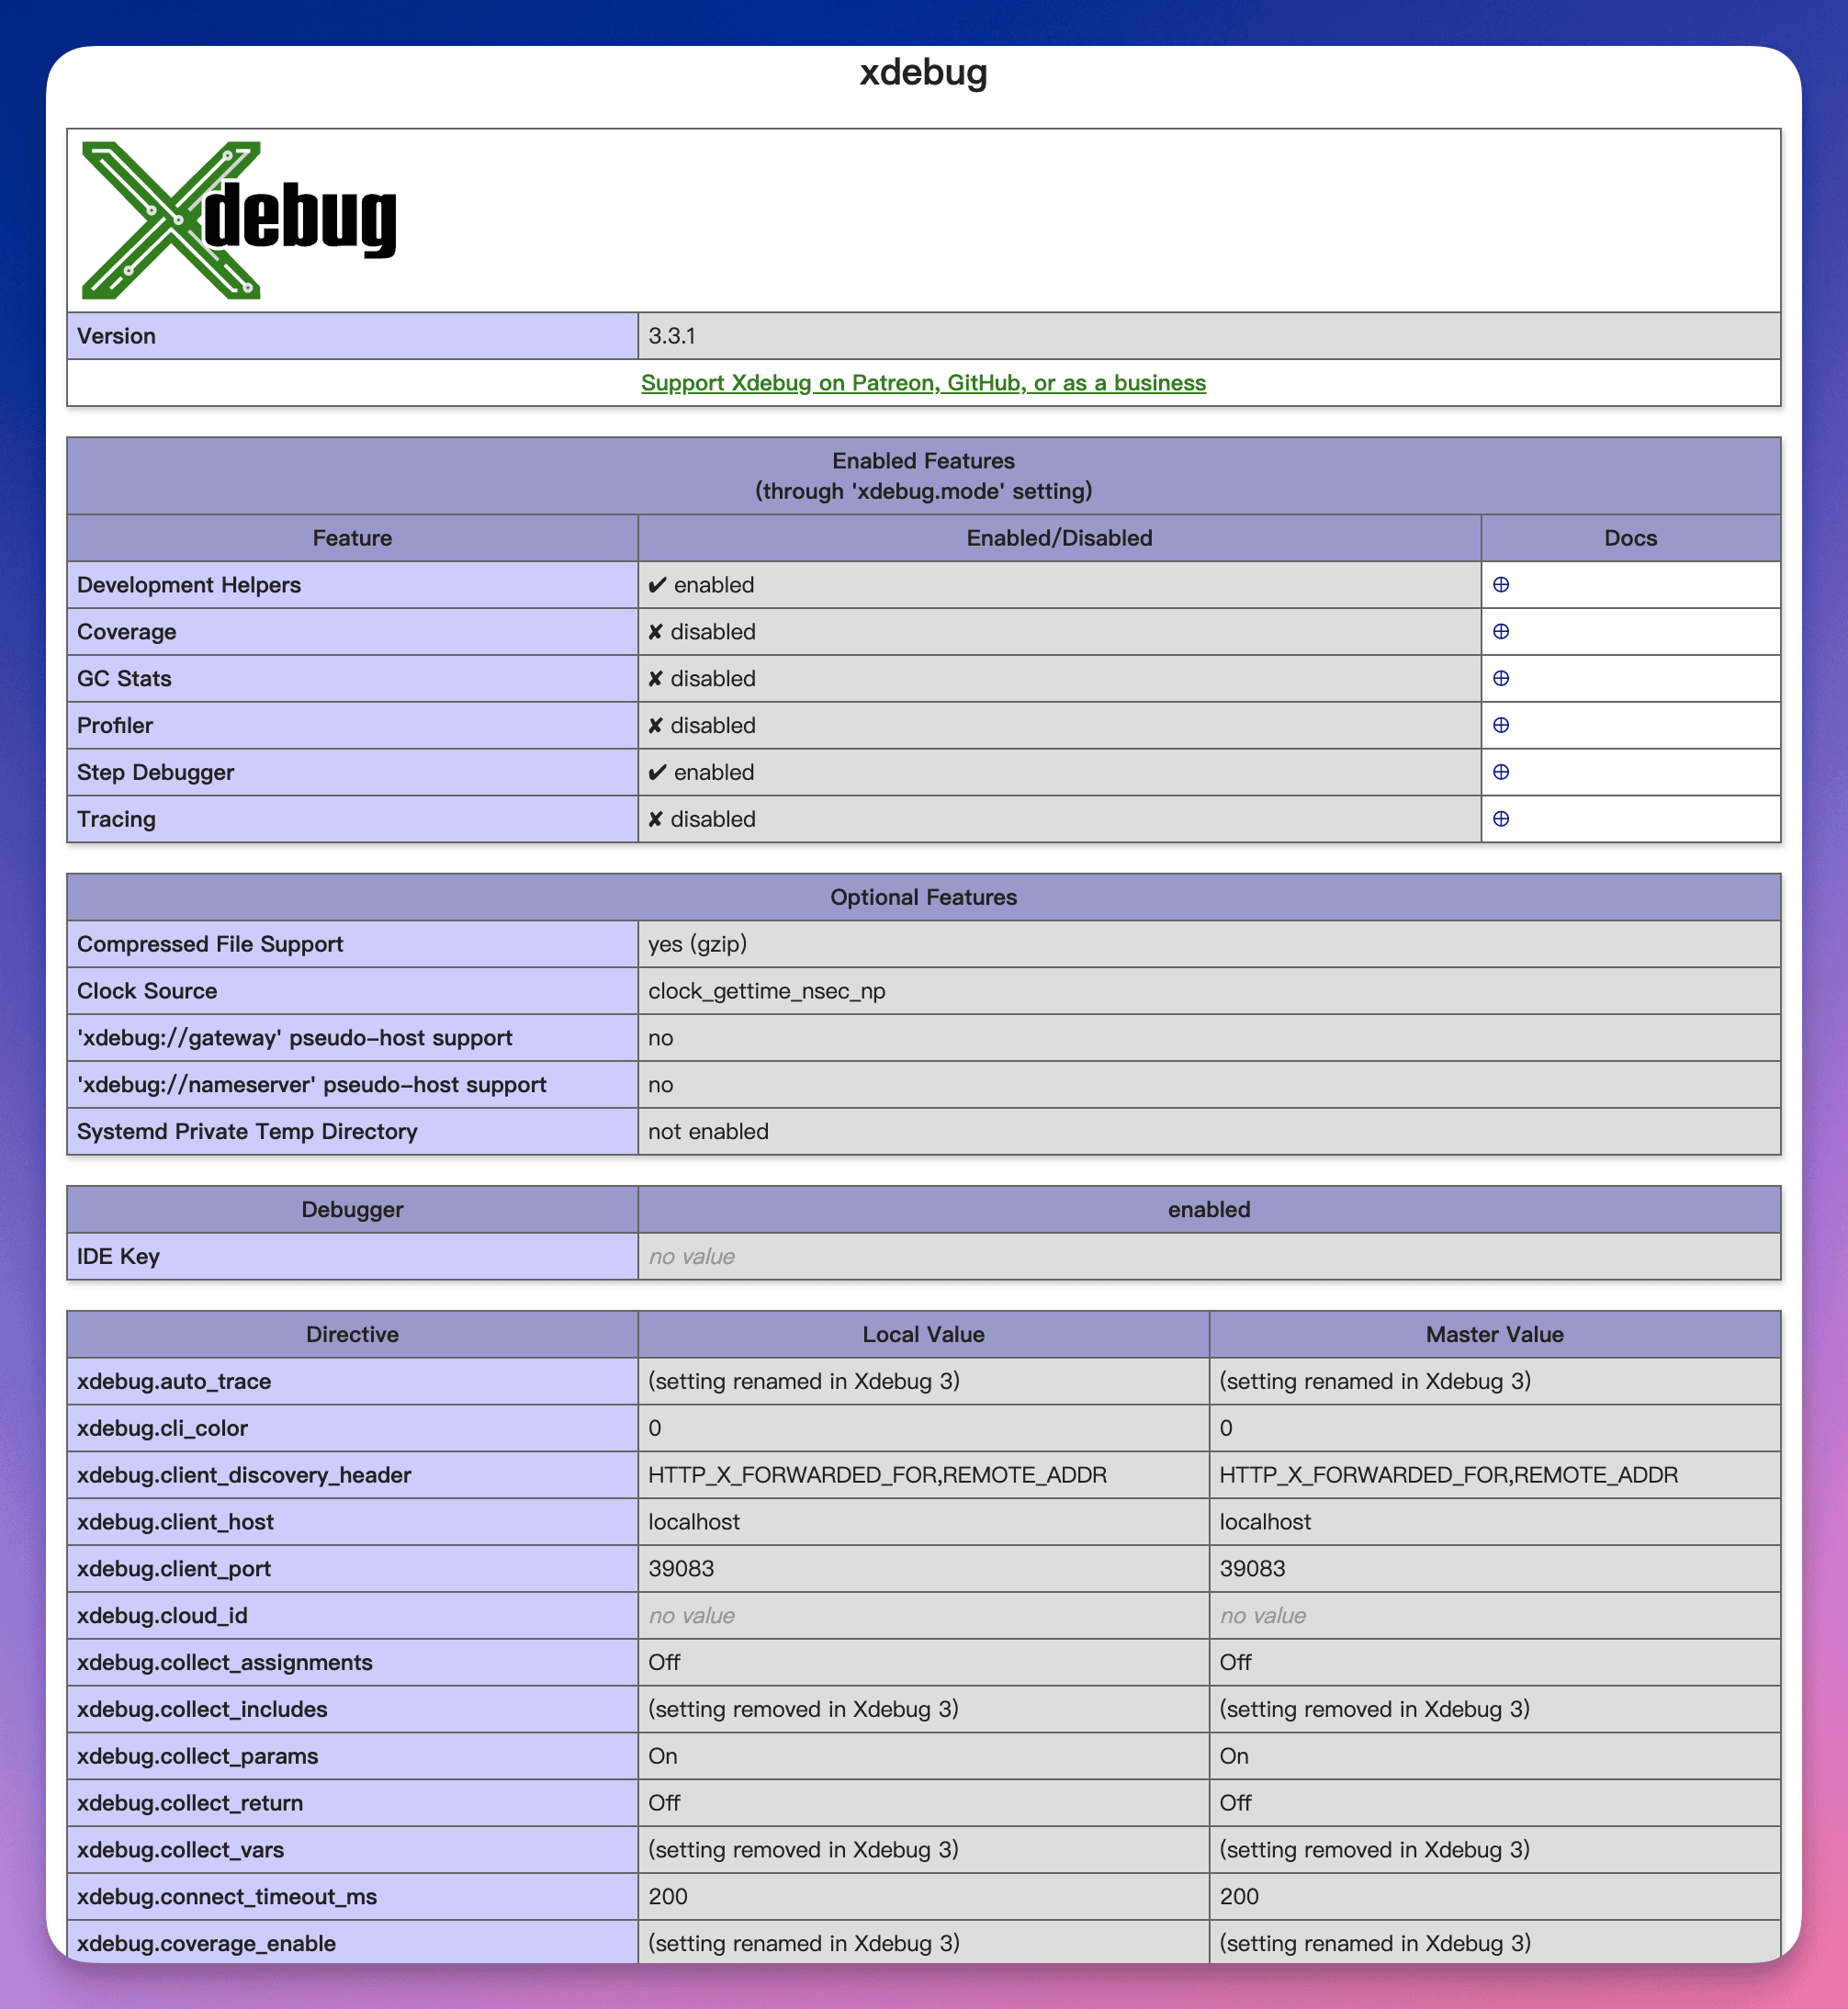 図:拡張機能からXdebugを有効化
Xdebugモジュールが正しくロードされたか確認する
もっとも確実な確認方法は、phpinfo() 関数でPHPの設定情報をチェックすることです。
- ServBayのWebサイトルート(デフォルト
/Applications/ServBay/www)にphpinfo.phpなどの簡単なPHPファイルを作成します phpinfo.phpファイルに以下の内容を記述します:php<?php phpinfo(); ?>- ブラウザで該当ファイル(例:
https://servbay.demo/phpinfo.php。servbay.demoは実際のドメインに置き換えてください)にアクセス - 出力されたphpinfoページで「Xdebug」を検索。Xdebugが有効であれば、「Xdebug」に関する独立した設定セクション(バージョンやパラメータの一覧)が表示されます
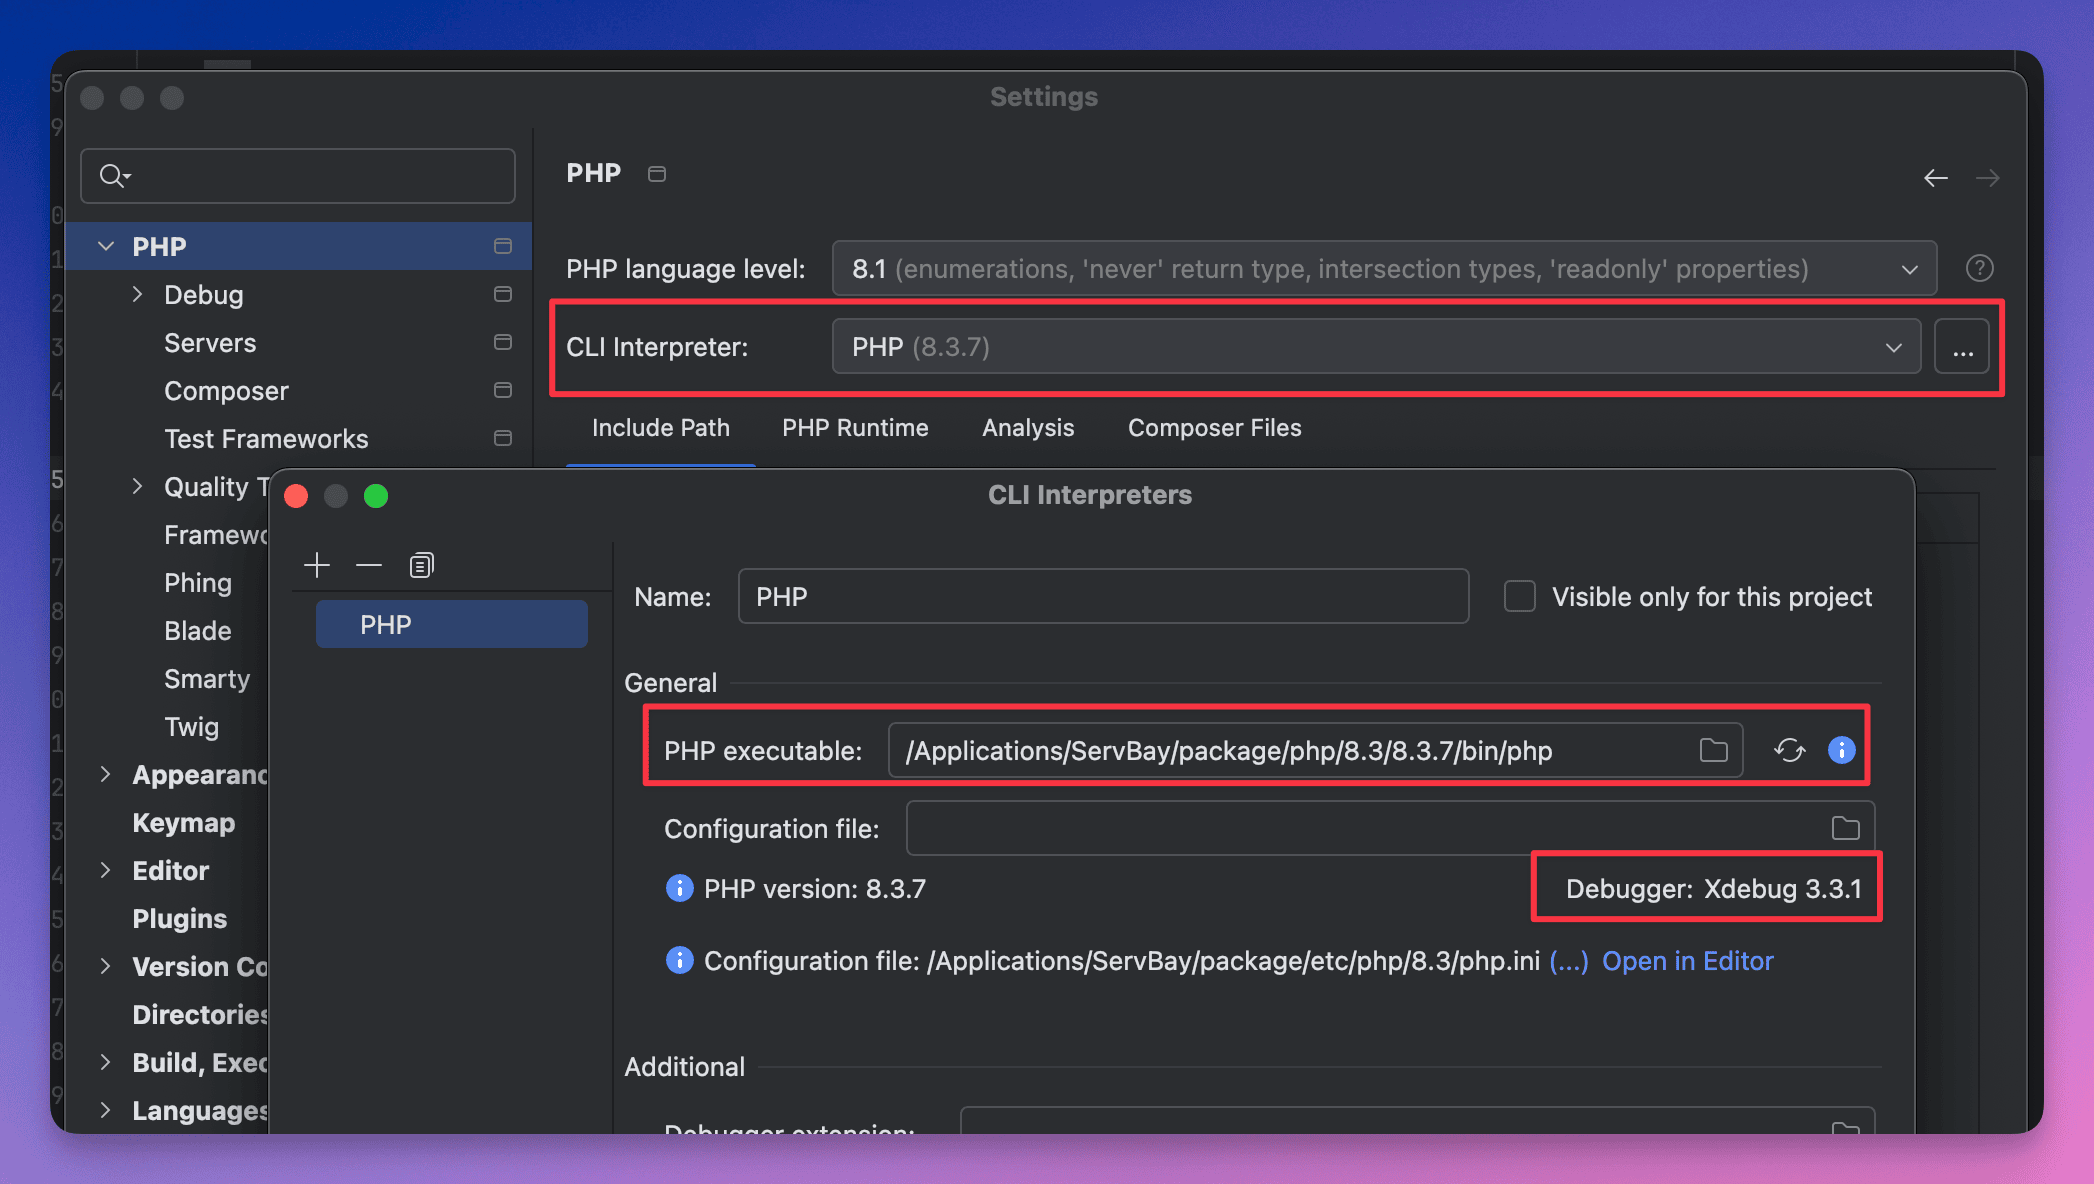 図:phpinfo出力でXdebug情報を確認
IDEでXdebugデバッグを設定する
Xdebugの有効化だけでなく、IDEでブレークポイントデバッグを行うには、IDE内でPHPインタープリター、デバッガー、サーバーマッピングを正しく設定する必要があります。ここではPHPStormとVisual Studio Code(VS Code)での設定手順を紹介します。
PHPStormでXdebugを設定する
PHPStormはXdebugデバッグをネイティブで強力にサポートします。
PHPStormの設定画面を開く: メニュー
File→Settings(Windows/Linux) またはPHPStorm→Preferences(macOS)から設定ウィンドウを起動PHP CLIインタープリターの追加:
Languages & Frameworks→PHPへ移動CLI Interpreterセクションの右側「...」ボタンをクリック- ポップアップで「+」を押して新しいローカルインタープリターを追加
- ServBay内の該当PHPバージョン(例:
/Applications/ServBay/package/php/8.3/8.3.7/bin/php。バージョン番号は環境によって異なるのでご注意を) - PHPStormが自動的にバージョン&拡張情報(Xdebugも含む)を検出
- 「OK」で設定を保存
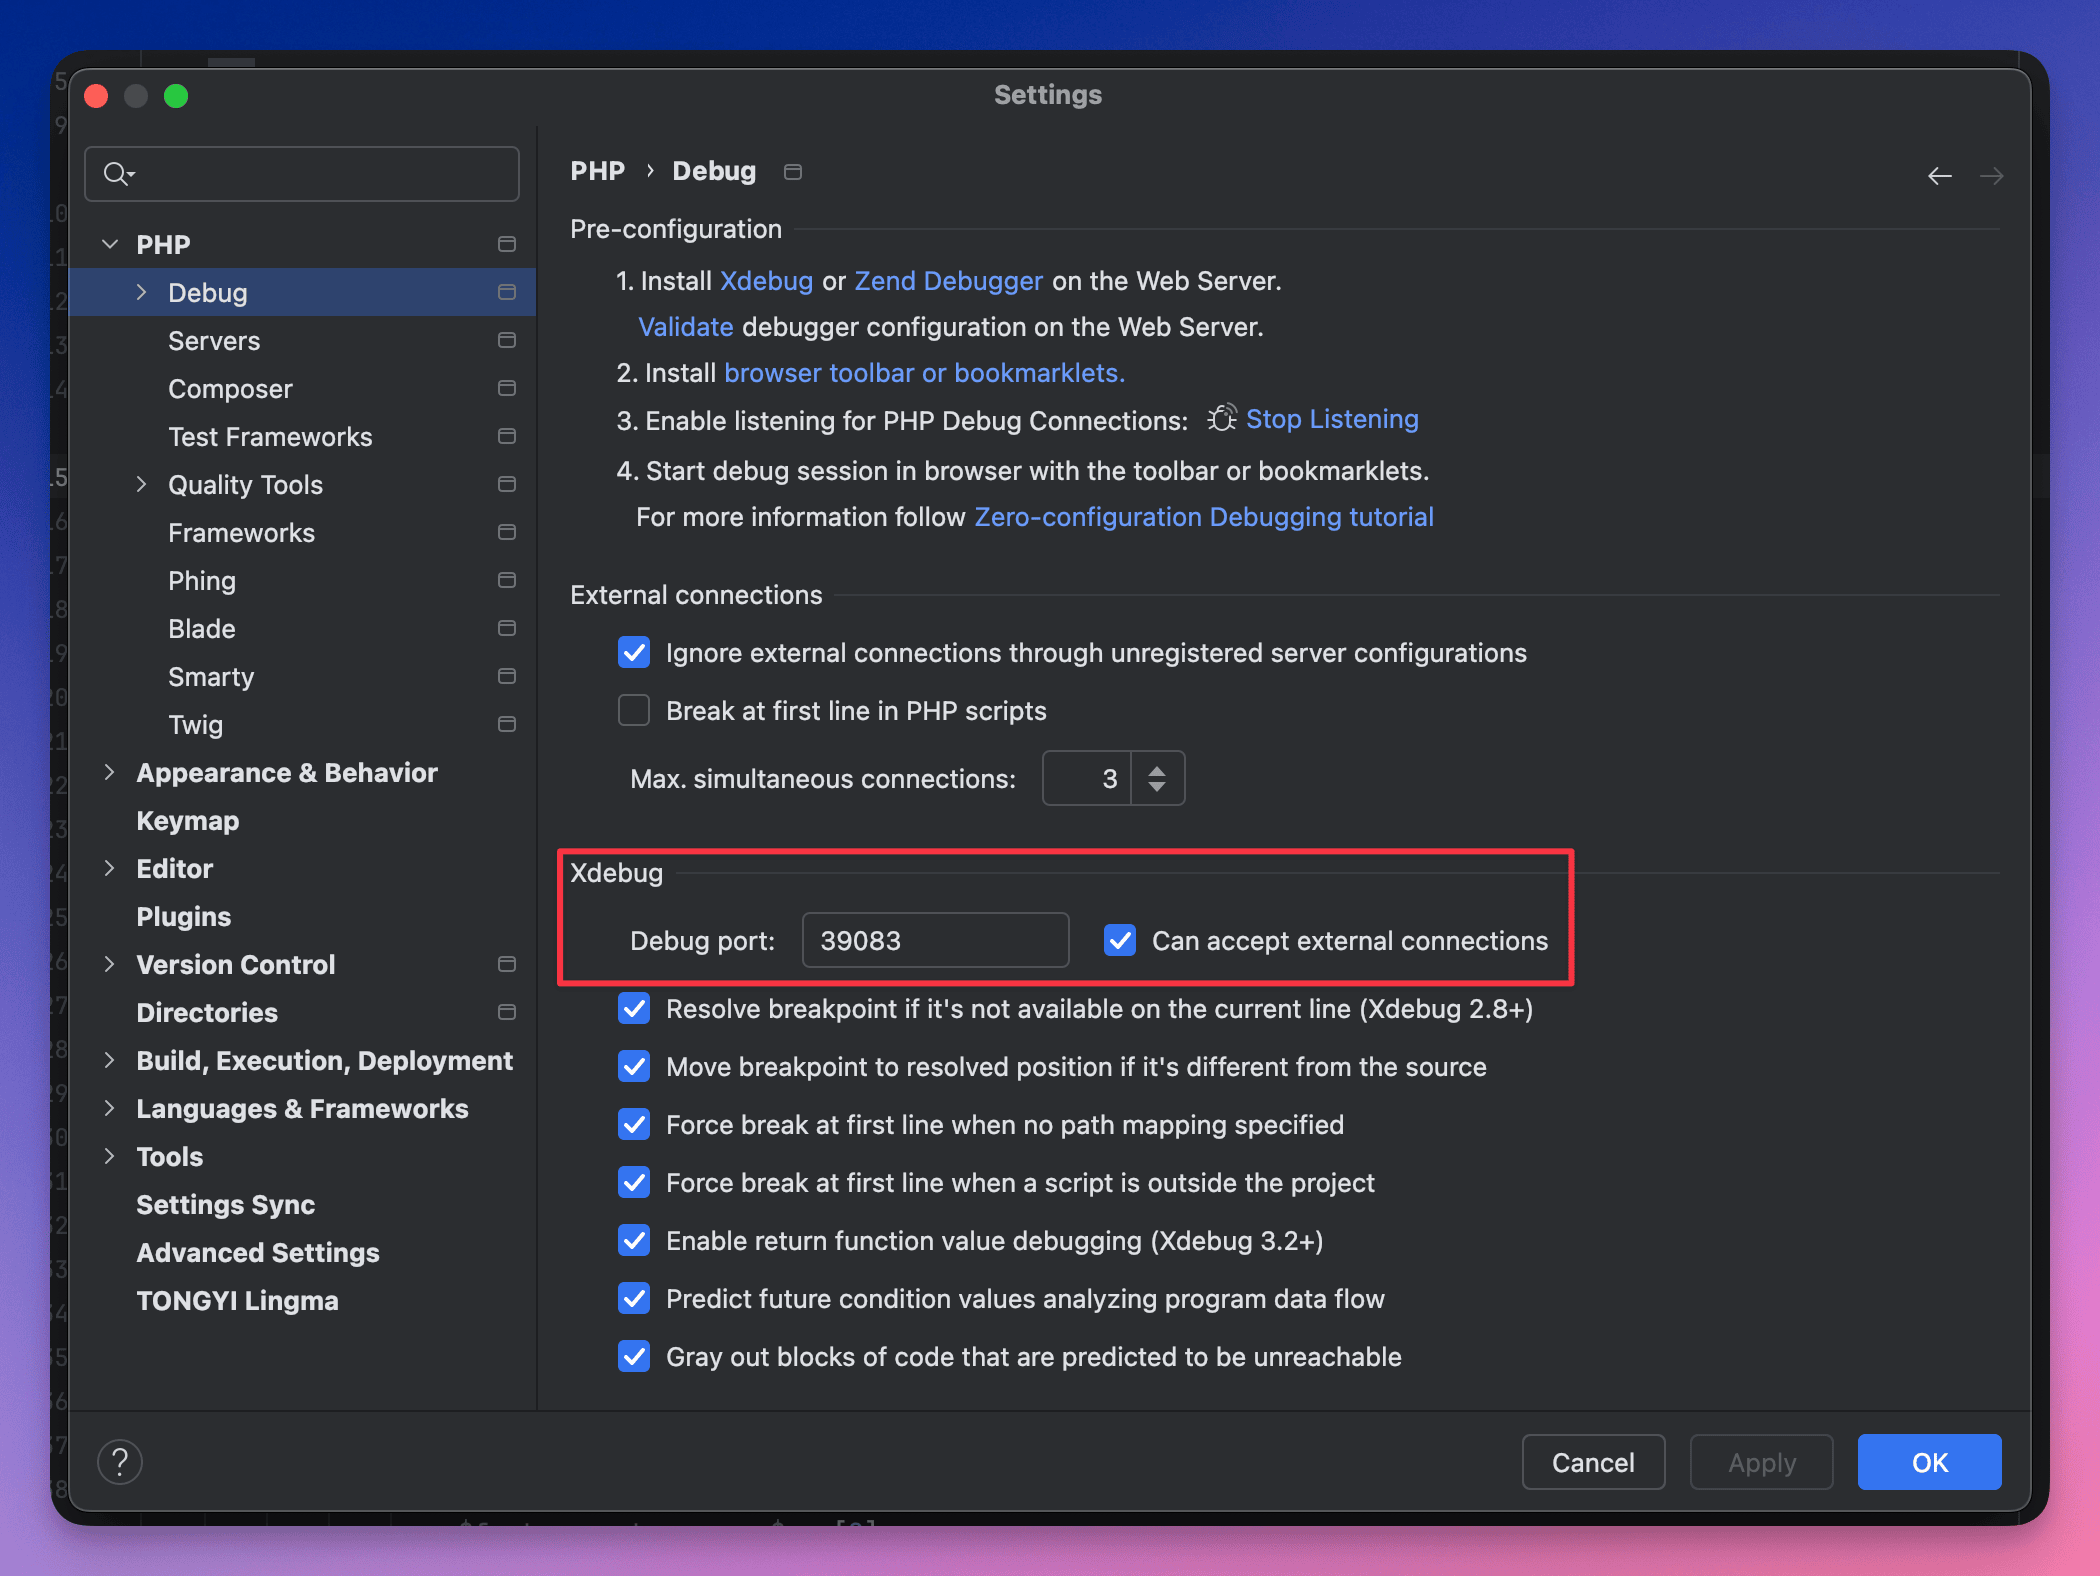 図:PHPStormへのServBay PHP CLIインタープリター登録例
Xdebugデバッグパラメータの設定:
Languages & Frameworks→PHP→Debug- 「Xdebug」欄の
Debug Portを、ServBayで有効化したPHPバージョンのXdebugポートに設定(例:PHP 8.3は39083)。この値とxdebug.client_port設定が一致しているか確認 - 「Can accept external connections」にチェック
- 「適用」「OK」で保存
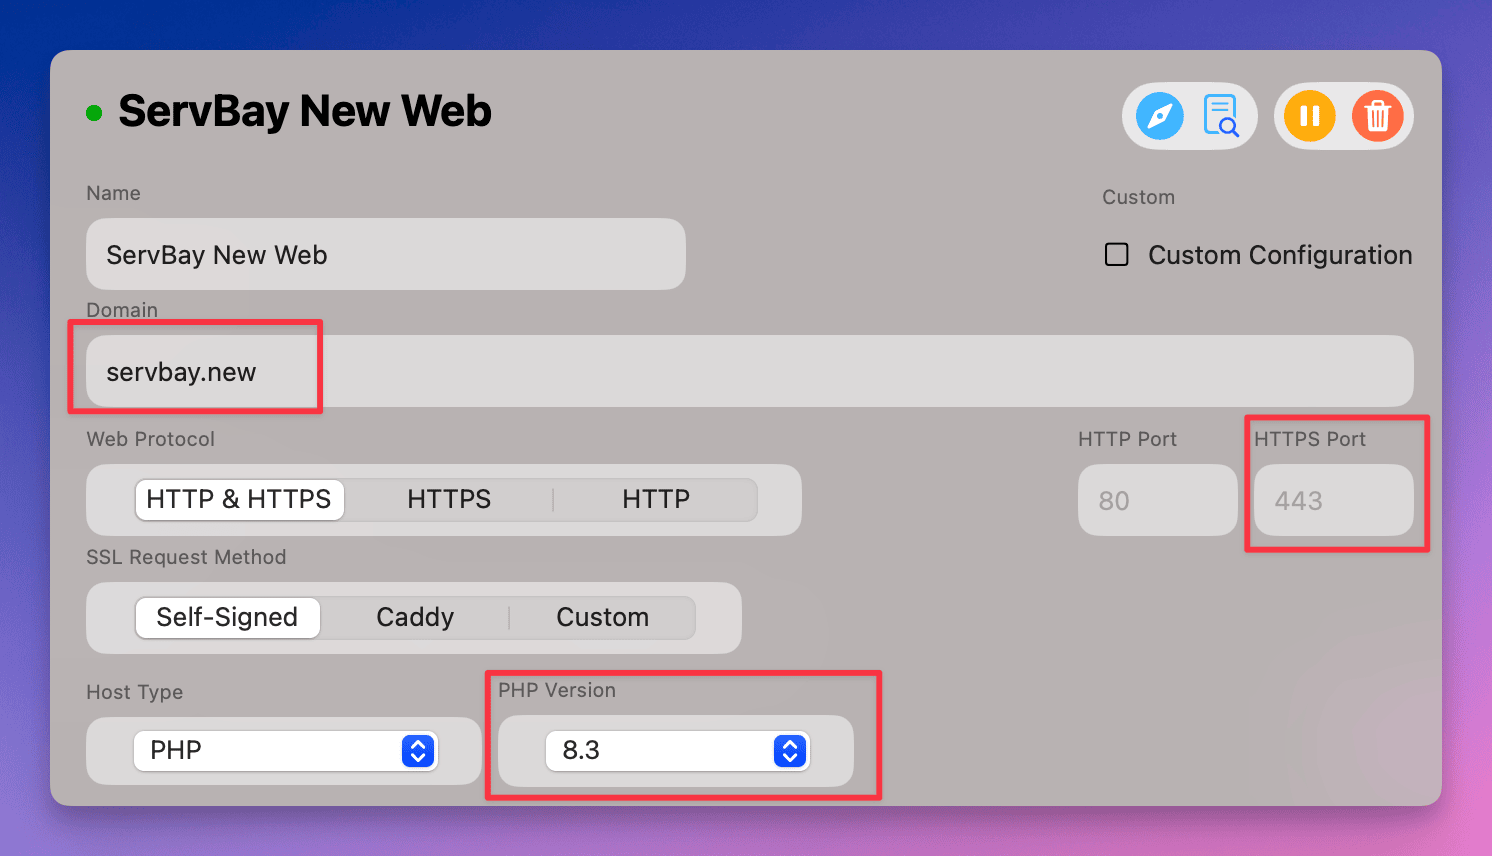 図:PHPStormでのXdebugリスニングポート設定例
PHP Webサーバーのパスマッピング設定:
Languages & Frameworks→PHP→Serversへ- 右側の「+」で新規サーバー設定を追加
- サーバー名(例:ServBay Localhost)を入力
Host欄にServBayのWebサイトドメイン(例:servbay.demo)、Port欄にWebサイトが使うポート(通常443(HTTPS)または80(HTTP))DebuggerはXdebugを選択- 「Use path mappings」にチェック
- ローカルプロジェクトパス(例:
/Applications/ServBay/www/myproject)とサーバー側ルート(例:/)を正しくマッピング。カスタムドメインやサブディレクトリ運用の場合もパス対応をしっかり設定してください - 「OK」で保存
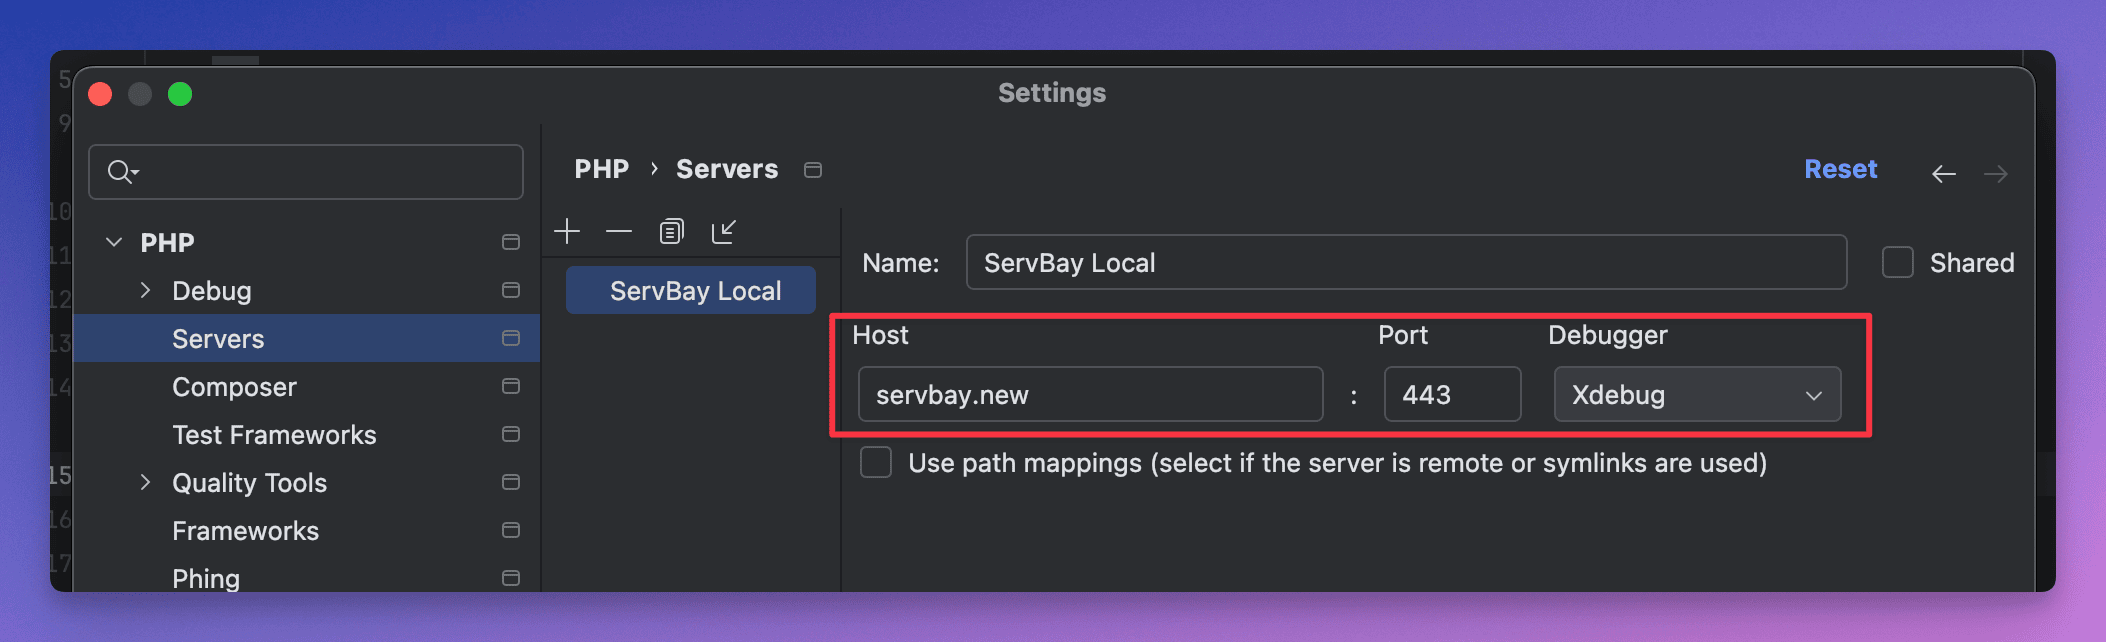
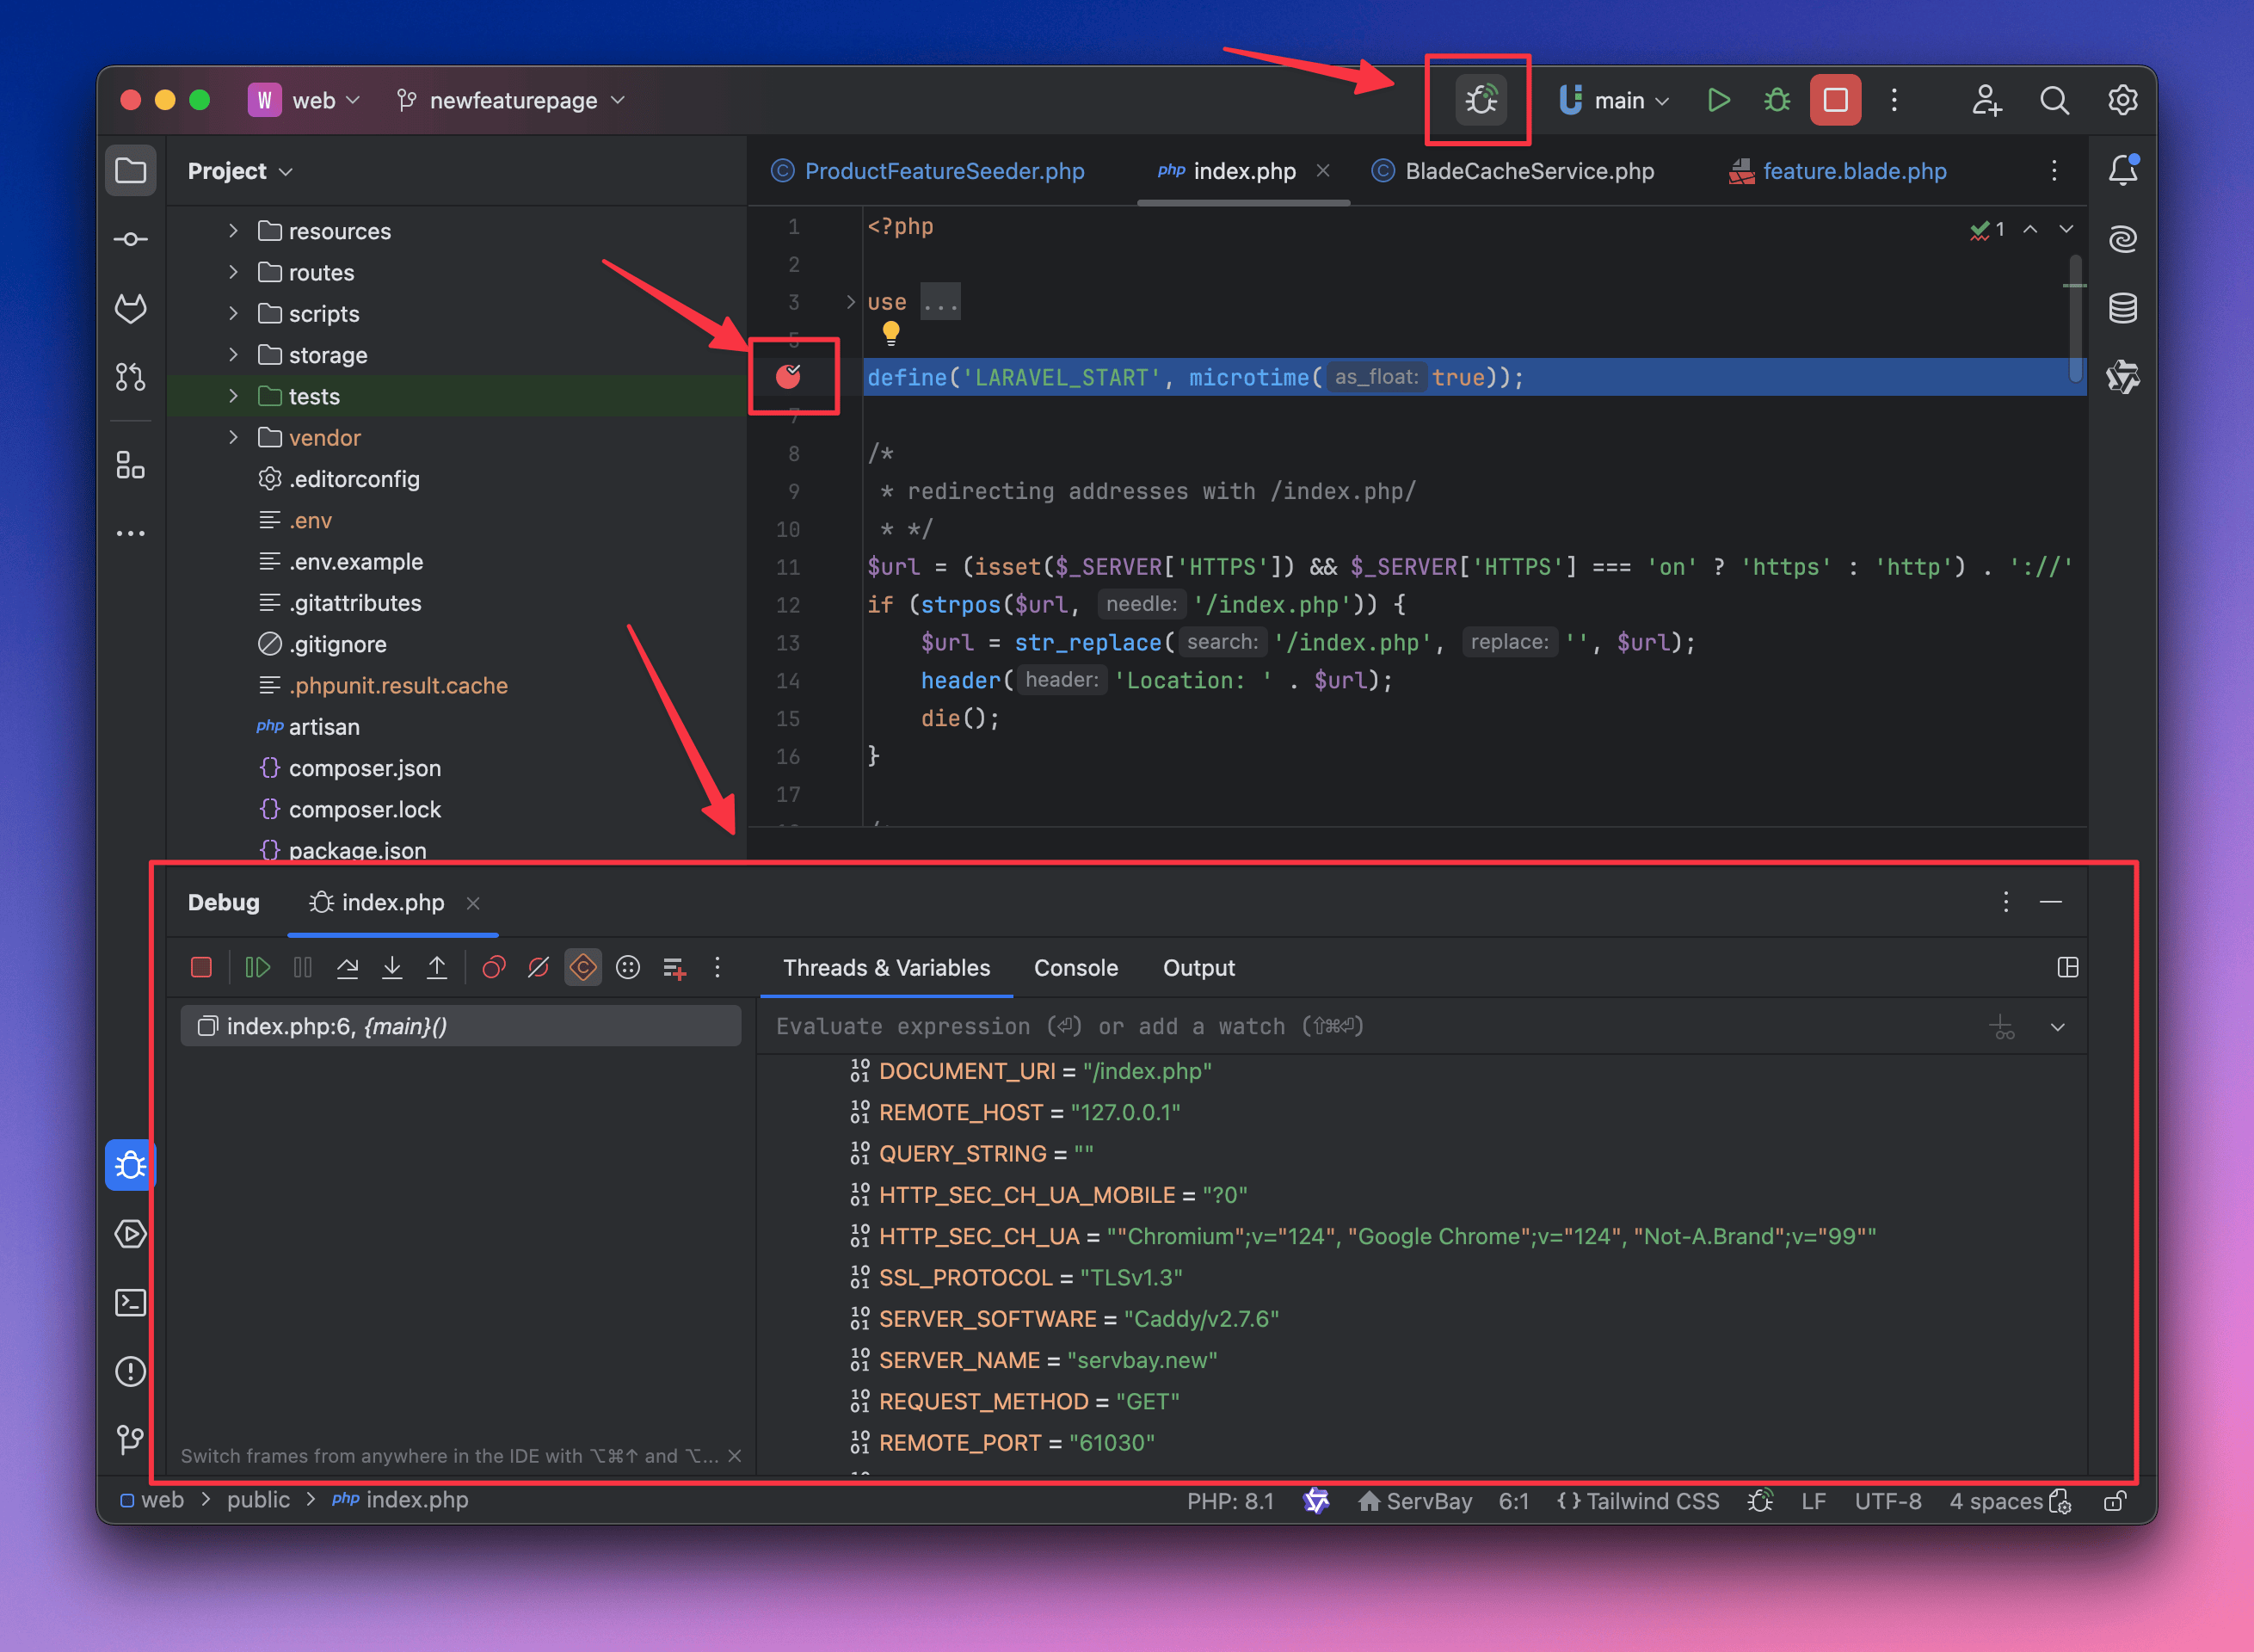 図:PHPStormのサーバー&パスマッピング設定例
デバッグセッションの開始:
- PHPStormでPHPプロジェクトを開く
- 左側の行番号横をクリックして行ブレークポイント(赤い丸)を置く
- ツールバーの「Start Listening for PHP Debug Connections」(虫アイコン)を押す。アイコンが緑になればリスニング開始状態
- ブラウザでPHPアプリ(例:
https://servbay.demo/index.php)へアクセス - 設定が正しければ、Xdebugが自動的にPHPStormに接続し、ブレークポイントで処理が一時停止。以後はPHPStorm上で各種デバッグ操作が可能
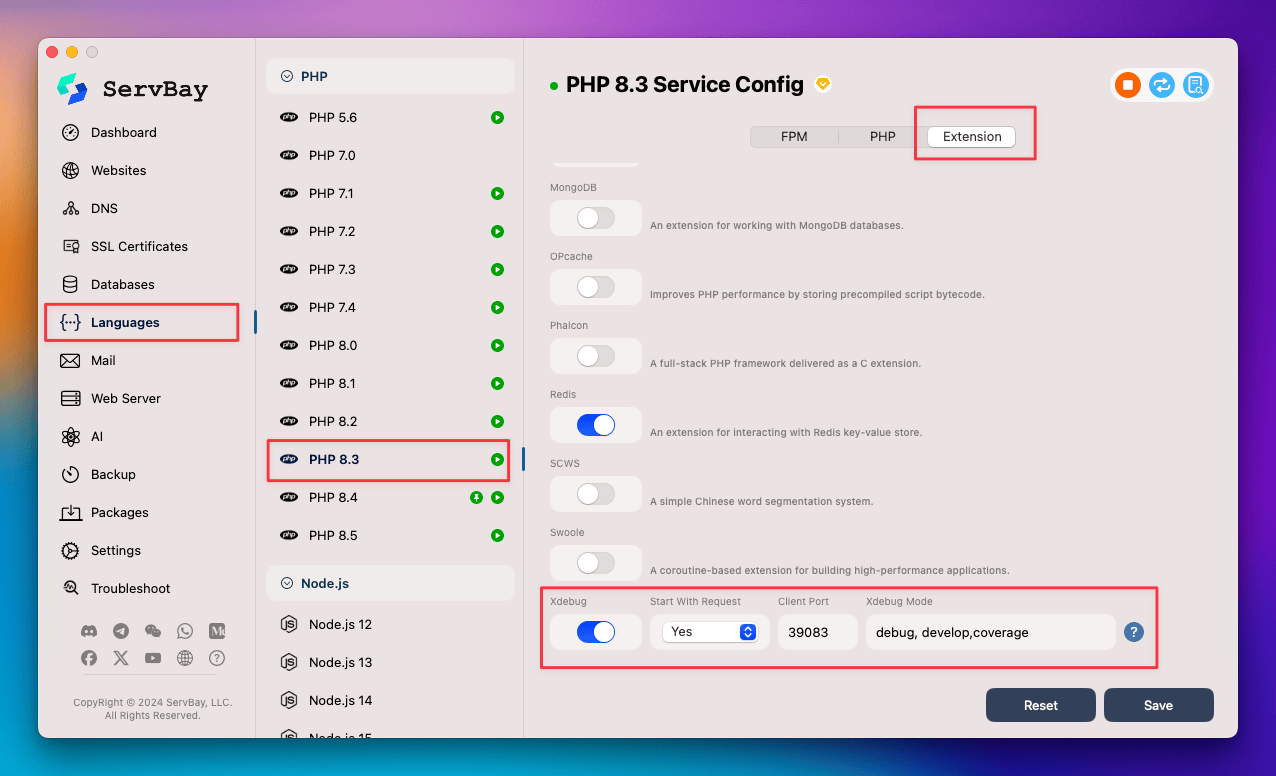 図:PHPStormでのXdebugリッスン開始ボタン
Visual Studio Code(VS Code)でXdebugを設定する
VS Codeも拡張機能を導入することでXdebugデバッグに対応できます。
PHP Debug拡張機能をインストール
- VS Codeを起動
- 拡張機能ビュー(
Ctrl+Shift+XまたはCmd+Shift+X)に切り替え - 「PHP Debug」を検索し、Felix Becker製のものをインストール
launch.jsonの編集- PHPプロジェクトのフォルダーを開く
- 実行&デバッグビュー(
Ctrl+Shift+DorCmd+Shift+D)に移動 - 上部ツールバーの歯車アイコンで「PHP」を選択→
.vscode/launch.jsonが自動生成 launch.json内の「Listen for Xdebug」設定を確認し、portをServBayで有効化しているPHPバージョンのポート(例:PHP 8.3なら39083)に合わせる- パスマッピング(pathMappings)の設定が重要です。以下のようにプロジェクトパスのマッピングを追加してくださいjsonサイト構成やプロジェクト配置に応じてpathMappingsを調整してください。
{ "version": "0.2.0", "configurations": [ { "name": "Listen for Xdebug", "type": "php", "request": "launch", "port": 39083, // ご利用のPHPバージョンに合わせて変更 "pathMappings": { // ServBayのWebサイトルートとローカルプロジェクトルートをマッピング "/": "${workspaceRoot}" // サブドメイン運用時等も "/" 対 "${workspaceRoot}" でOK } }, { "name": "Launch currently open script", "type": "php", "request": "launch", "program": "${file}", "cwd": "${fileDirname}", "port": 39083 // 同様にバージョンに合わせて } ] }${workspaceRoot}は現在VS Codeで開いているプロジェクトルートを指します。
デバッグセッションの開始
- VS CodeでPHPファイルを開く
- 行番号横をクリックしてブレークポイント(赤丸)を設置
- 実行&デバッグビューに移動
- 設定した「Listen for Xdebug」構成を選択
- グリーンの再生ボタンでデバッグ開始。ステータスバーがオレンジ色になればリスニング状態
- ブラウザからPHPアプリにアクセスし、Xdebug接続とブレークポイント停止が確認できるはずです
よくある質問(FAQ)
Q:
phpinfo()にXdebugが表示されない場合は?- A: ServBayのGUI、または
xdebug.iniを手動編集してXdebugが有効になっているか確認 - 対応するPHPサービスを再起動したか確認
xdebug.iniのパスやzend_extension = xdebug.soのコメントアウト解除も確認- ServBayログ(
/Applications/ServBay/logs/php/<version>/error.log)でエラーが出ていないかチェック
- A: ServBayのGUI、または
Q: IDEでブレークポイントをセットしても停止しない場合は?
- A: IDEでXdebugのリスニングが有効(PHPStorm虫アイコン緑、VS Codeステータスバー橙)か確認
- IDEでのXdebugポート設定とServBay側(
xdebug.client_port)設定が一致しているか確認 - パスマッピング(pathMapping) の誤りがないかは最重要ポイント
- ファイアウォール等でXdebugポート(
390xx台)が遮断されていないかも要確認 xdebug.iniでxdebug.start_with_request=triggerを利用している場合、Xdebugトリガー(ブラウザ拡張や?XDEBUG_TRIGGER=1)をリクエストに含めてください
Q: Xdebug接続が途中で切断されてしまう場合は?
- A:
xdebug.iniのxdebug.remote_autostartやxdebug.start_with_requestの設定値を確認。常時有効(yes)だと毎回リクエスト開始でデバッグが走るため、「trigger」モード利用が推奨 - IDE側のデバッグセッションタイムアウト設定にも注意
- A:
まとめ
ServBayはXdebugをプリインストールし設定も直感的にできるため、PHP開発者がXdebugを使い始めるハードルを大きく下げます。GUIからも設定ファイルの手動編集からも、各PHPバージョンごとに簡単にXdebugを有効化できます。さらにPHPStormやVS Codeなど主要IDEの高度なデバッグ機能と組み合わせることで、PHPコードの効率的なデバッグ・パフォーマンスチューニング・品質管理が可能に。ServBay×Xdebugの活用で、ローカルPHP開発ワークフローは格段に進化します。
