How to Enable and Configure Xdebug in ServBay
As a powerful local web development environment, ServBay comes pre-integrated with Xdebug, the essential debugging and profiling tool for PHP developers. Enabling Xdebug can significantly boost your PHP development efficiency, making debugging, performance profiling, and code coverage analysis much more convenient. This guide will walk you through enabling and configuring Xdebug in ServBay, as well as integrating it with popular IDEs.
Overview of the Xdebug Module
Xdebug is a feature-rich PHP extension designed for code debugging and analysis. ServBay pre-installs Xdebug, saving developers from the hassle of manual compilation and installation and making the setup process straightforward and user-friendly.
Key Features of Xdebug
- Breakpoint Debugging: Set breakpoints at specific lines in your code. When execution hits a breakpoint, it pauses, allowing you to inspect variables, call stacks, and step through your code line by line.
- Step Debugging: Supports various step operations—Step Over, Step Into, Step Out—making it easy to follow program flow.
- Variable Monitoring: View the values of local and global variables in real-time during debugging.
- Stack Tracing: Provides detailed function call stacks when errors or exceptions occur, helping pinpoint the source of problems quickly.
- Profiling: Generates performance reports for code execution, helping identify bottlenecks.
- Code Coverage: Measures how much of your code is covered by tests, providing invaluable insights for test effectiveness.
Built-in Xdebug Versions and Port Mapping in ServBay
ServBay pre-installs the corresponding Xdebug module for each PHP version it supports. It's important to note that each PHP version uses a dedicated Xdebug listening port based on its version number, which is crucial for configuring your IDE debugger.
| PHP Version | Built-in Xdebug Version | Default Xdebug Listening Port |
|---|---|---|
| PHP 5.6 | Xdebug 2.5.5 | 39056 |
| PHP 7.0 | Xdebug 2.5.5 | 39070 |
| PHP 7.1 | Xdebug 2.5.5 | 39071 |
| PHP 7.2 | Xdebug 3.1.6 | 39072 |
| PHP 7.3 | Xdebug 3.1.6 | 39073 |
| PHP 7.4 | Xdebug 3.1.6 | 39074 |
| PHP 8.0 | Xdebug 3.3.1 | 39080 |
| PHP 8.1 | Xdebug 3.4.0 | 39081 |
| PHP 8.2 | Xdebug 3.4.0 | 39082 |
| PHP 8.3 | Xdebug 3.4.0 | 39083 |
| PHP 8.4 | Xdebug 3.4.0 | 39084 |
| PHP 8.5 | Xdebug 3.4.0 | 39085 |
Port Rule
The default listening port rule for Xdebug is 39000 + PHP minor version. For example, PHP 8.3 uses port 39000 + 83 = 39083, and PHP 7.4 uses 39000 + 74 = 39074. Knowing this rule helps you quickly determine the correct Xdebug port for any PHP version.
How to Enable the Xdebug Module
Enabling the Xdebug module in ServBay is straightforward, and it's recommended to use the intuitive ServBay GUI. Alternatively, you can manually edit the configuration file.
Enabling Xdebug via the ServBay GUI
This is the fastest and easiest method.
- Open the ServBay application interface.
- In the left sidebar, select
Languages. - Expand the
PHPsection and locate the PHP version for which you wish to enable Xdebug, such asPHP 8.3. - Click the
Extensionsbutton next to that version. - In the pop-up extension list, find the
Xdebugmodule. - Flip the switch to enable Xdebug (turn it on).
- Adjust configuration options as needed.
- Click the
Savebutton at the bottom of the interface. - ServBay will automatically restart the PHP process and load the module.
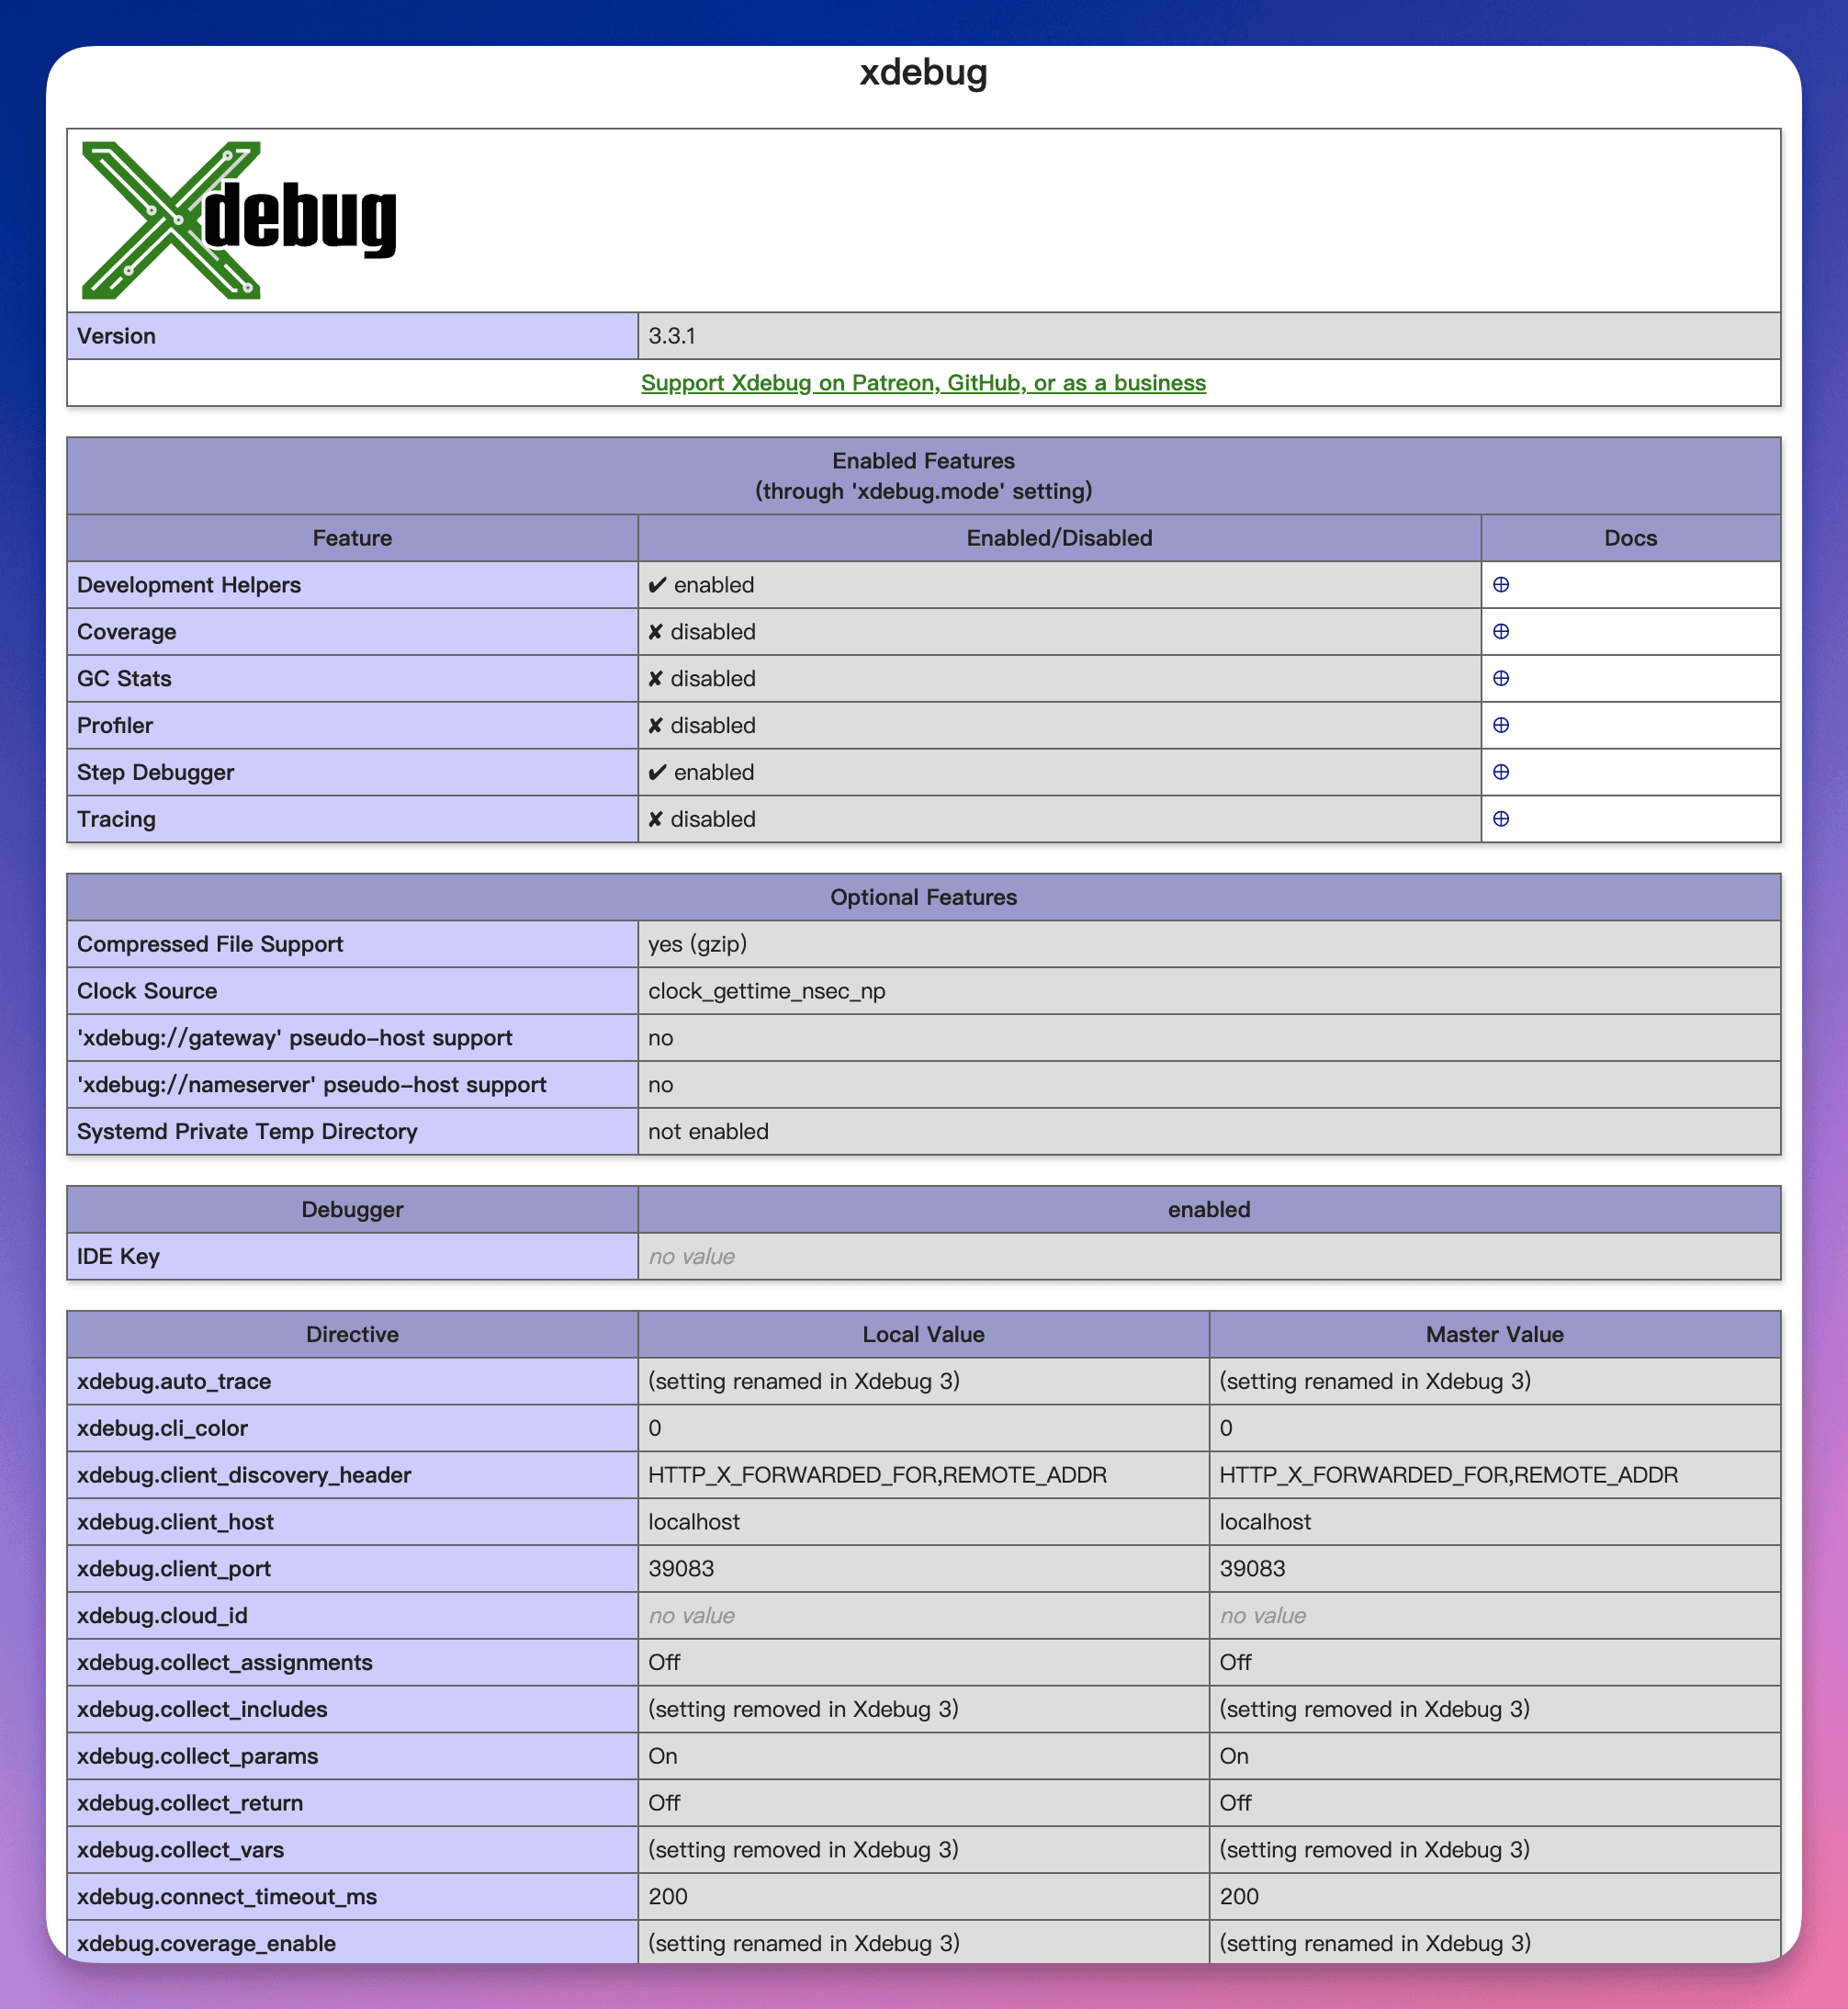 Illustration: Enabling Xdebug in the Extensions section
Verifying Xdebug is Successfully Loaded
The most reliable way to verify Xdebug is loaded is by checking your PHP configuration using the phpinfo() function.
- In the website root directory of ServBay (default
/Applications/ServBay/www), create a simple PHP file, for examplephpinfo.php. - Add the following content to
phpinfo.php:php<?php phpinfo(); ?> - Access this file in your browser, for example at
https://servbay.demo/phpinfo.php(replaceservbay.demowith your configured domain). - In the outputted
phpinfopage, search for "Xdebug". If the module is loaded, you’ll see a separate "Xdebug" configuration section, including version information and various parameters.
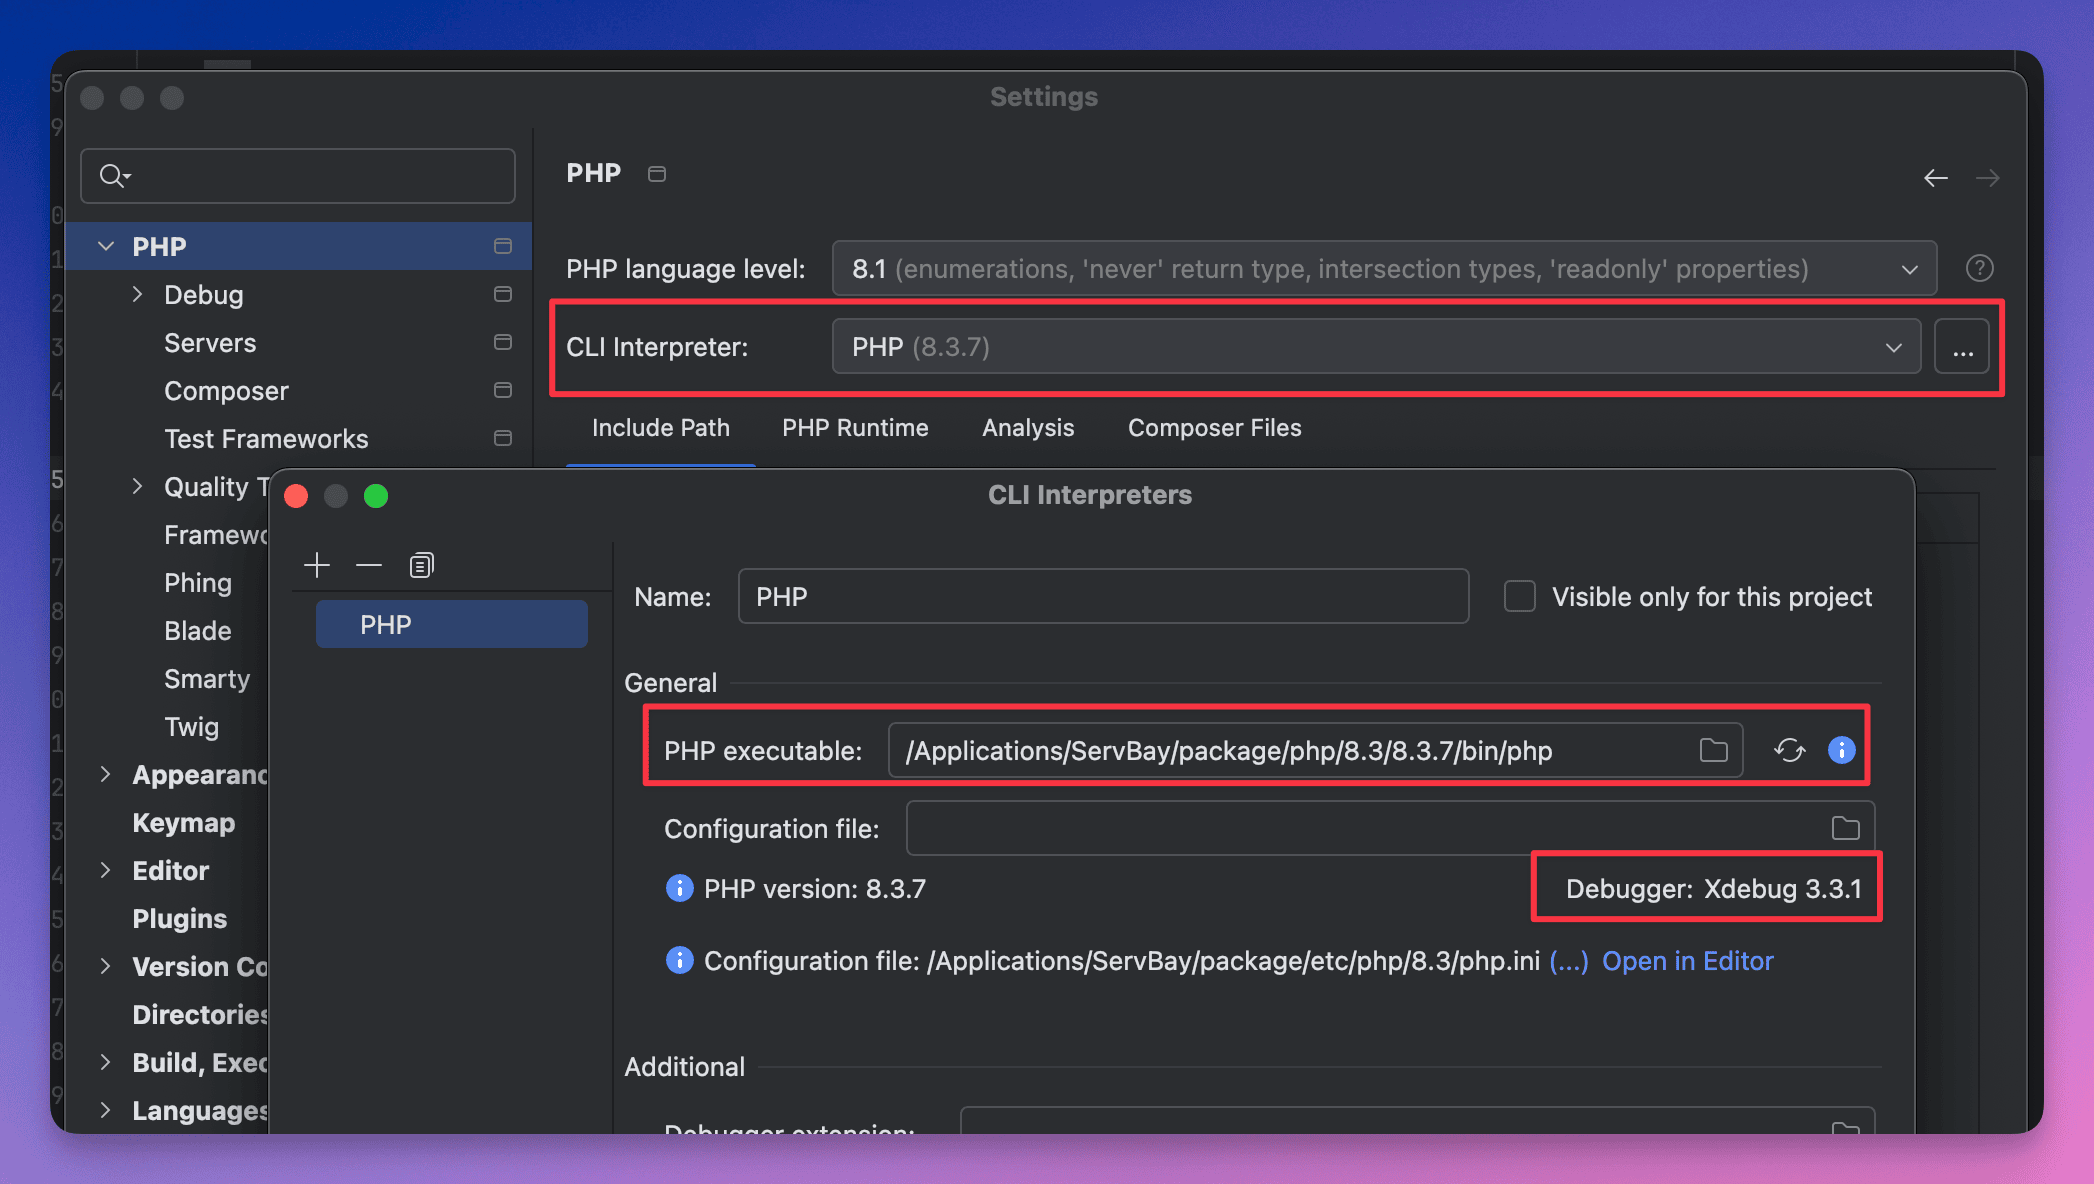 Illustration: Locating Xdebug info in phpinfo output
Configuring Xdebug Debugging in Your IDE
Enabling Xdebug is only the first step—you’ll also need to configure your IDE with the correct PHP interpreter, debugger, and server mappings. Below are step-by-step guides for both PHPStorm and Visual Studio Code (VS Code).
Setting Up Xdebug in PHPStorm
PHPStorm has robust support for Xdebug.
Open PHPStorm Settings: Launch PHPStorm and open the settings dialog via
File->Settings(Windows/Linux) orPHPStorm->Preferences(macOS).Configure the PHP CLI Interpreter:
- Navigate to
Languages & Frameworks->PHP. - Under
CLI Interpreter, click the...button on the right. - In the dialog, click the
+icon to add a new local interpreter. - Select the CLI binary path for your chosen PHP version in ServBay, e.g.,
/Applications/ServBay/package/php/8.3/8.3.7/bin/php(the version may differ; adjust as per your installation). - PHPStorm will detect the version and installed extensions, including Xdebug.
- Click
OKto save.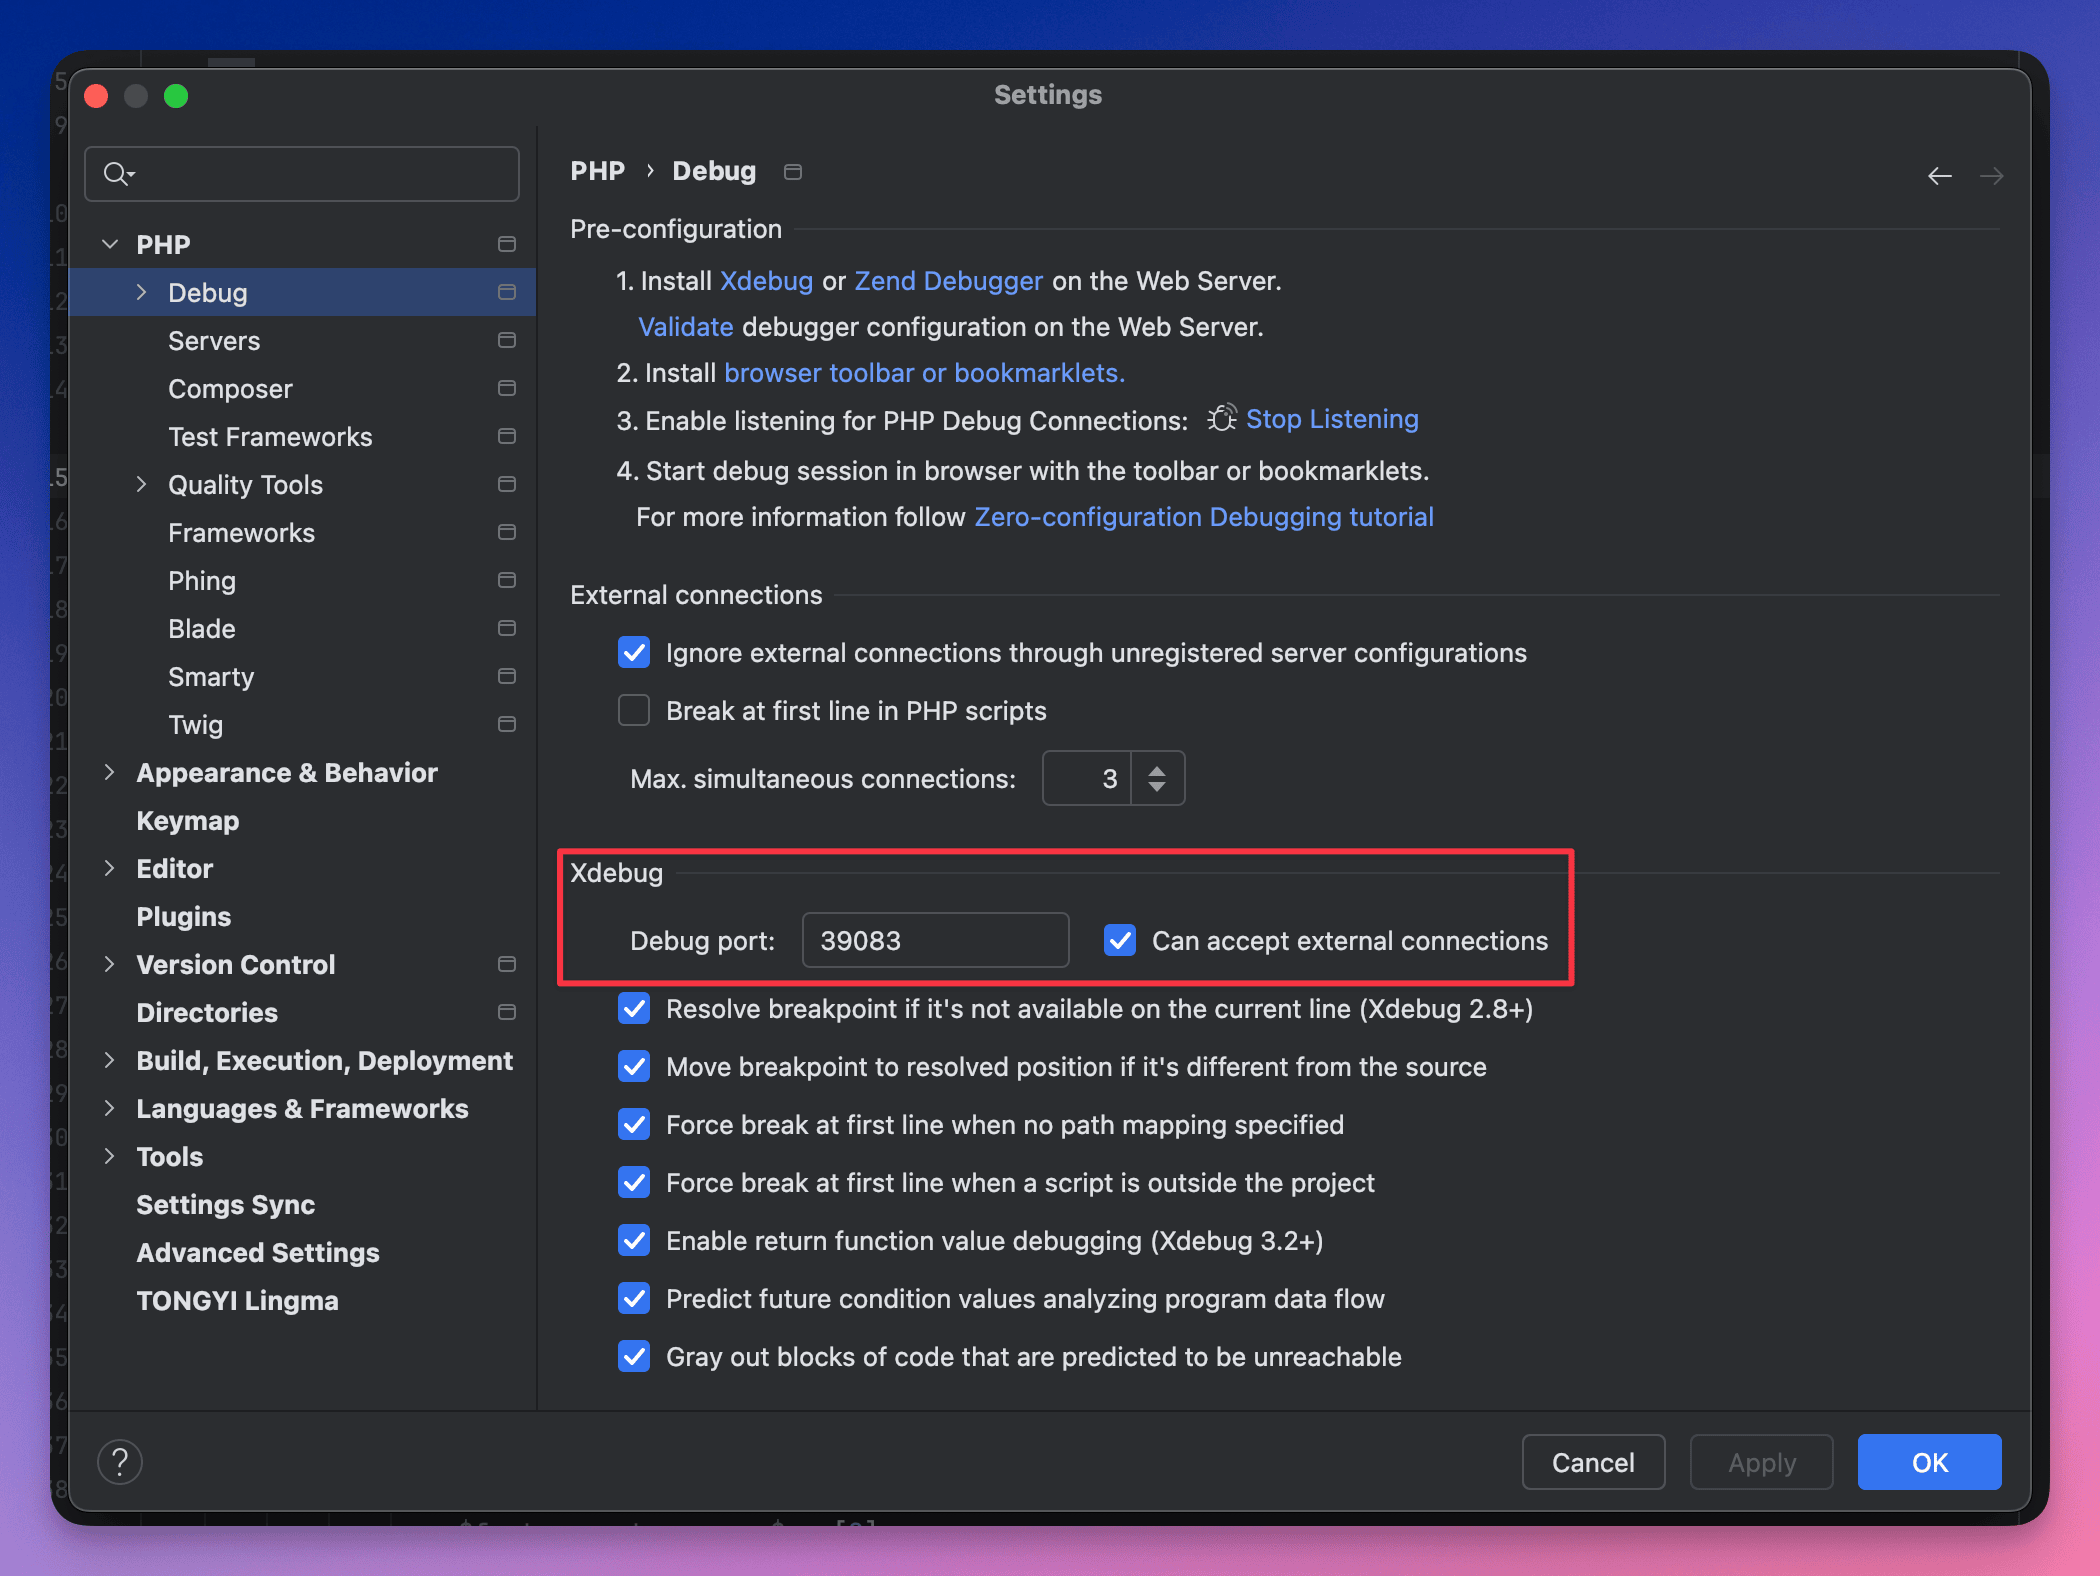 Illustration: Configuring ServBay's PHP CLI interpreter in PHPStorm
- Navigate to
Set Xdebug Debugging Options:
- Go to
Languages & Frameworks->PHP->Debug. - Set
Debug Portto match the Xdebug listening port for your chosen PHP version in ServBay (e.g., use39083for PHP 8.3). Make sure this matches thexdebug.client_portsetting. - Check the
Can accept external connectionsoption. - Click
Applyand thenOKto save.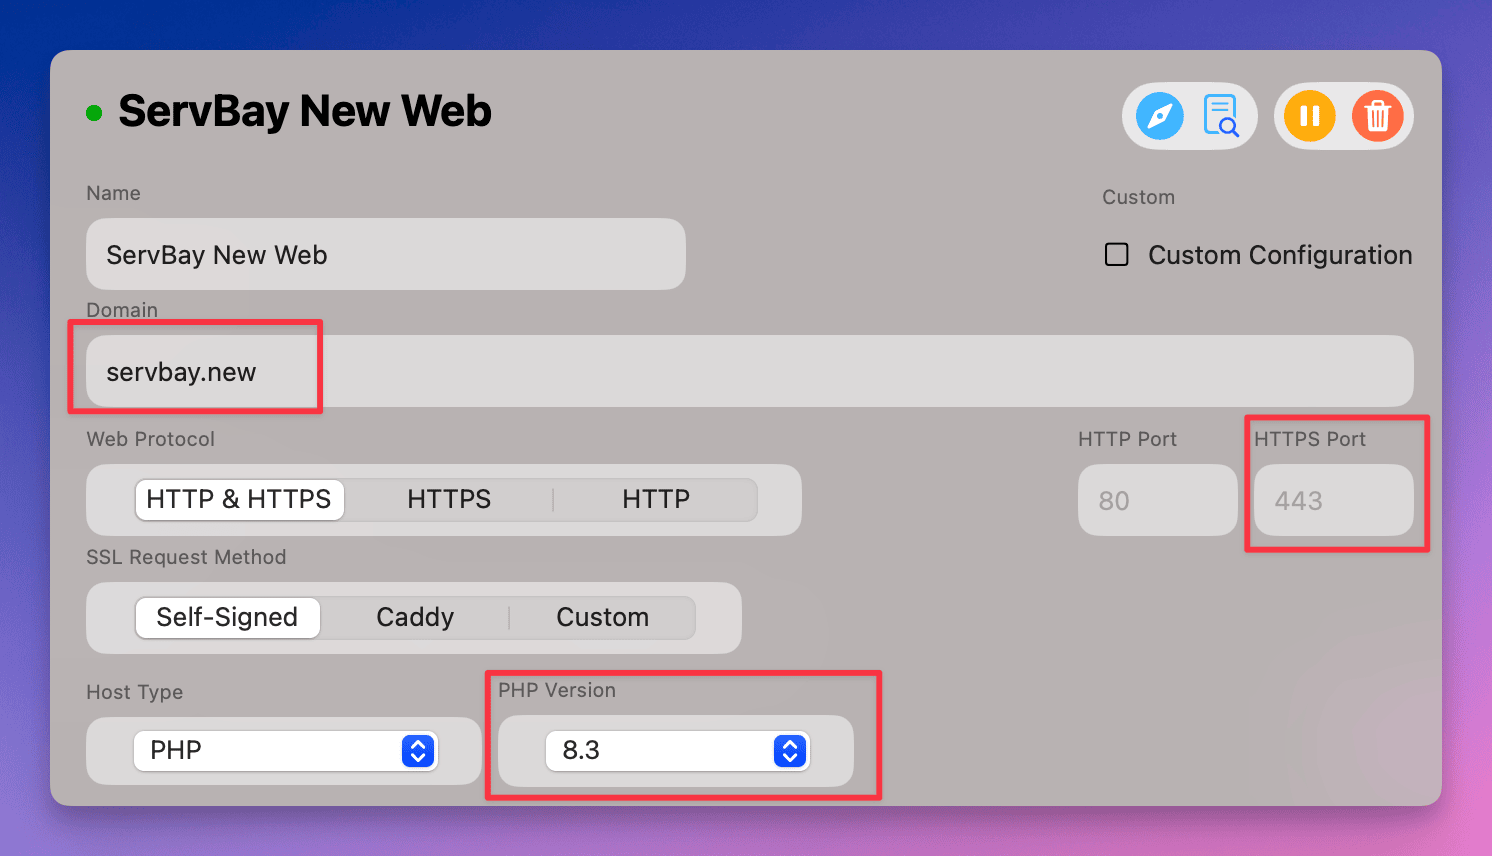 Illustration: Setting the Xdebug port in PHPStorm
- Go to
Configure PHP Web Server Mapping:
- Navigate to
Languages & Frameworks->PHP->Servers. - Click the
+button to add a new server configuration. - Specify a server name (e.g.,
ServBay Localhost). - Set
Hostto your configured website domain (e.g.,servbay.demo). - Set
Portto the web server’s port, typically443(HTTPS) or80(HTTP). - Set
DebuggertoXdebug. - Check
Use path mappings. - Map your local project path (
Absolute path to local source) to the server path (Absolute path on the server). For example, if the project is in/Applications/ServBay/www/myprojectand accessed viahttps://servbay.demo/, map/Applications/ServBay/www/myprojectto/. If you access viahttps://myproject.servbay.demo/and your root is/Applications/ServBay/www/myproject, also map local path/Applications/ServBay/www/myprojectto/. Ensuring correct path mapping is vital for Xdebug to work. - Click
OKto save.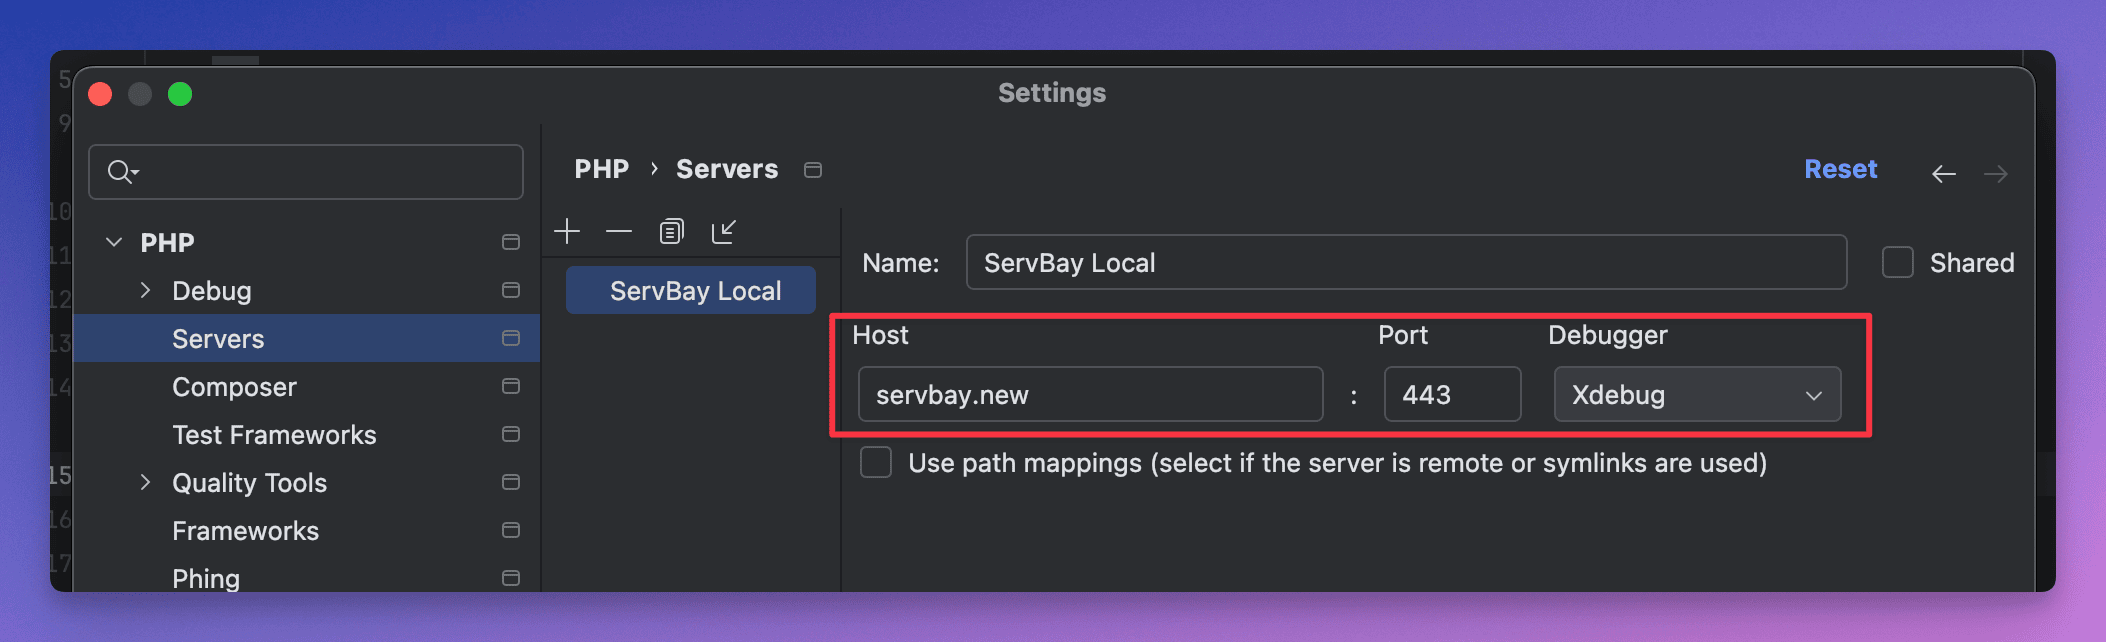
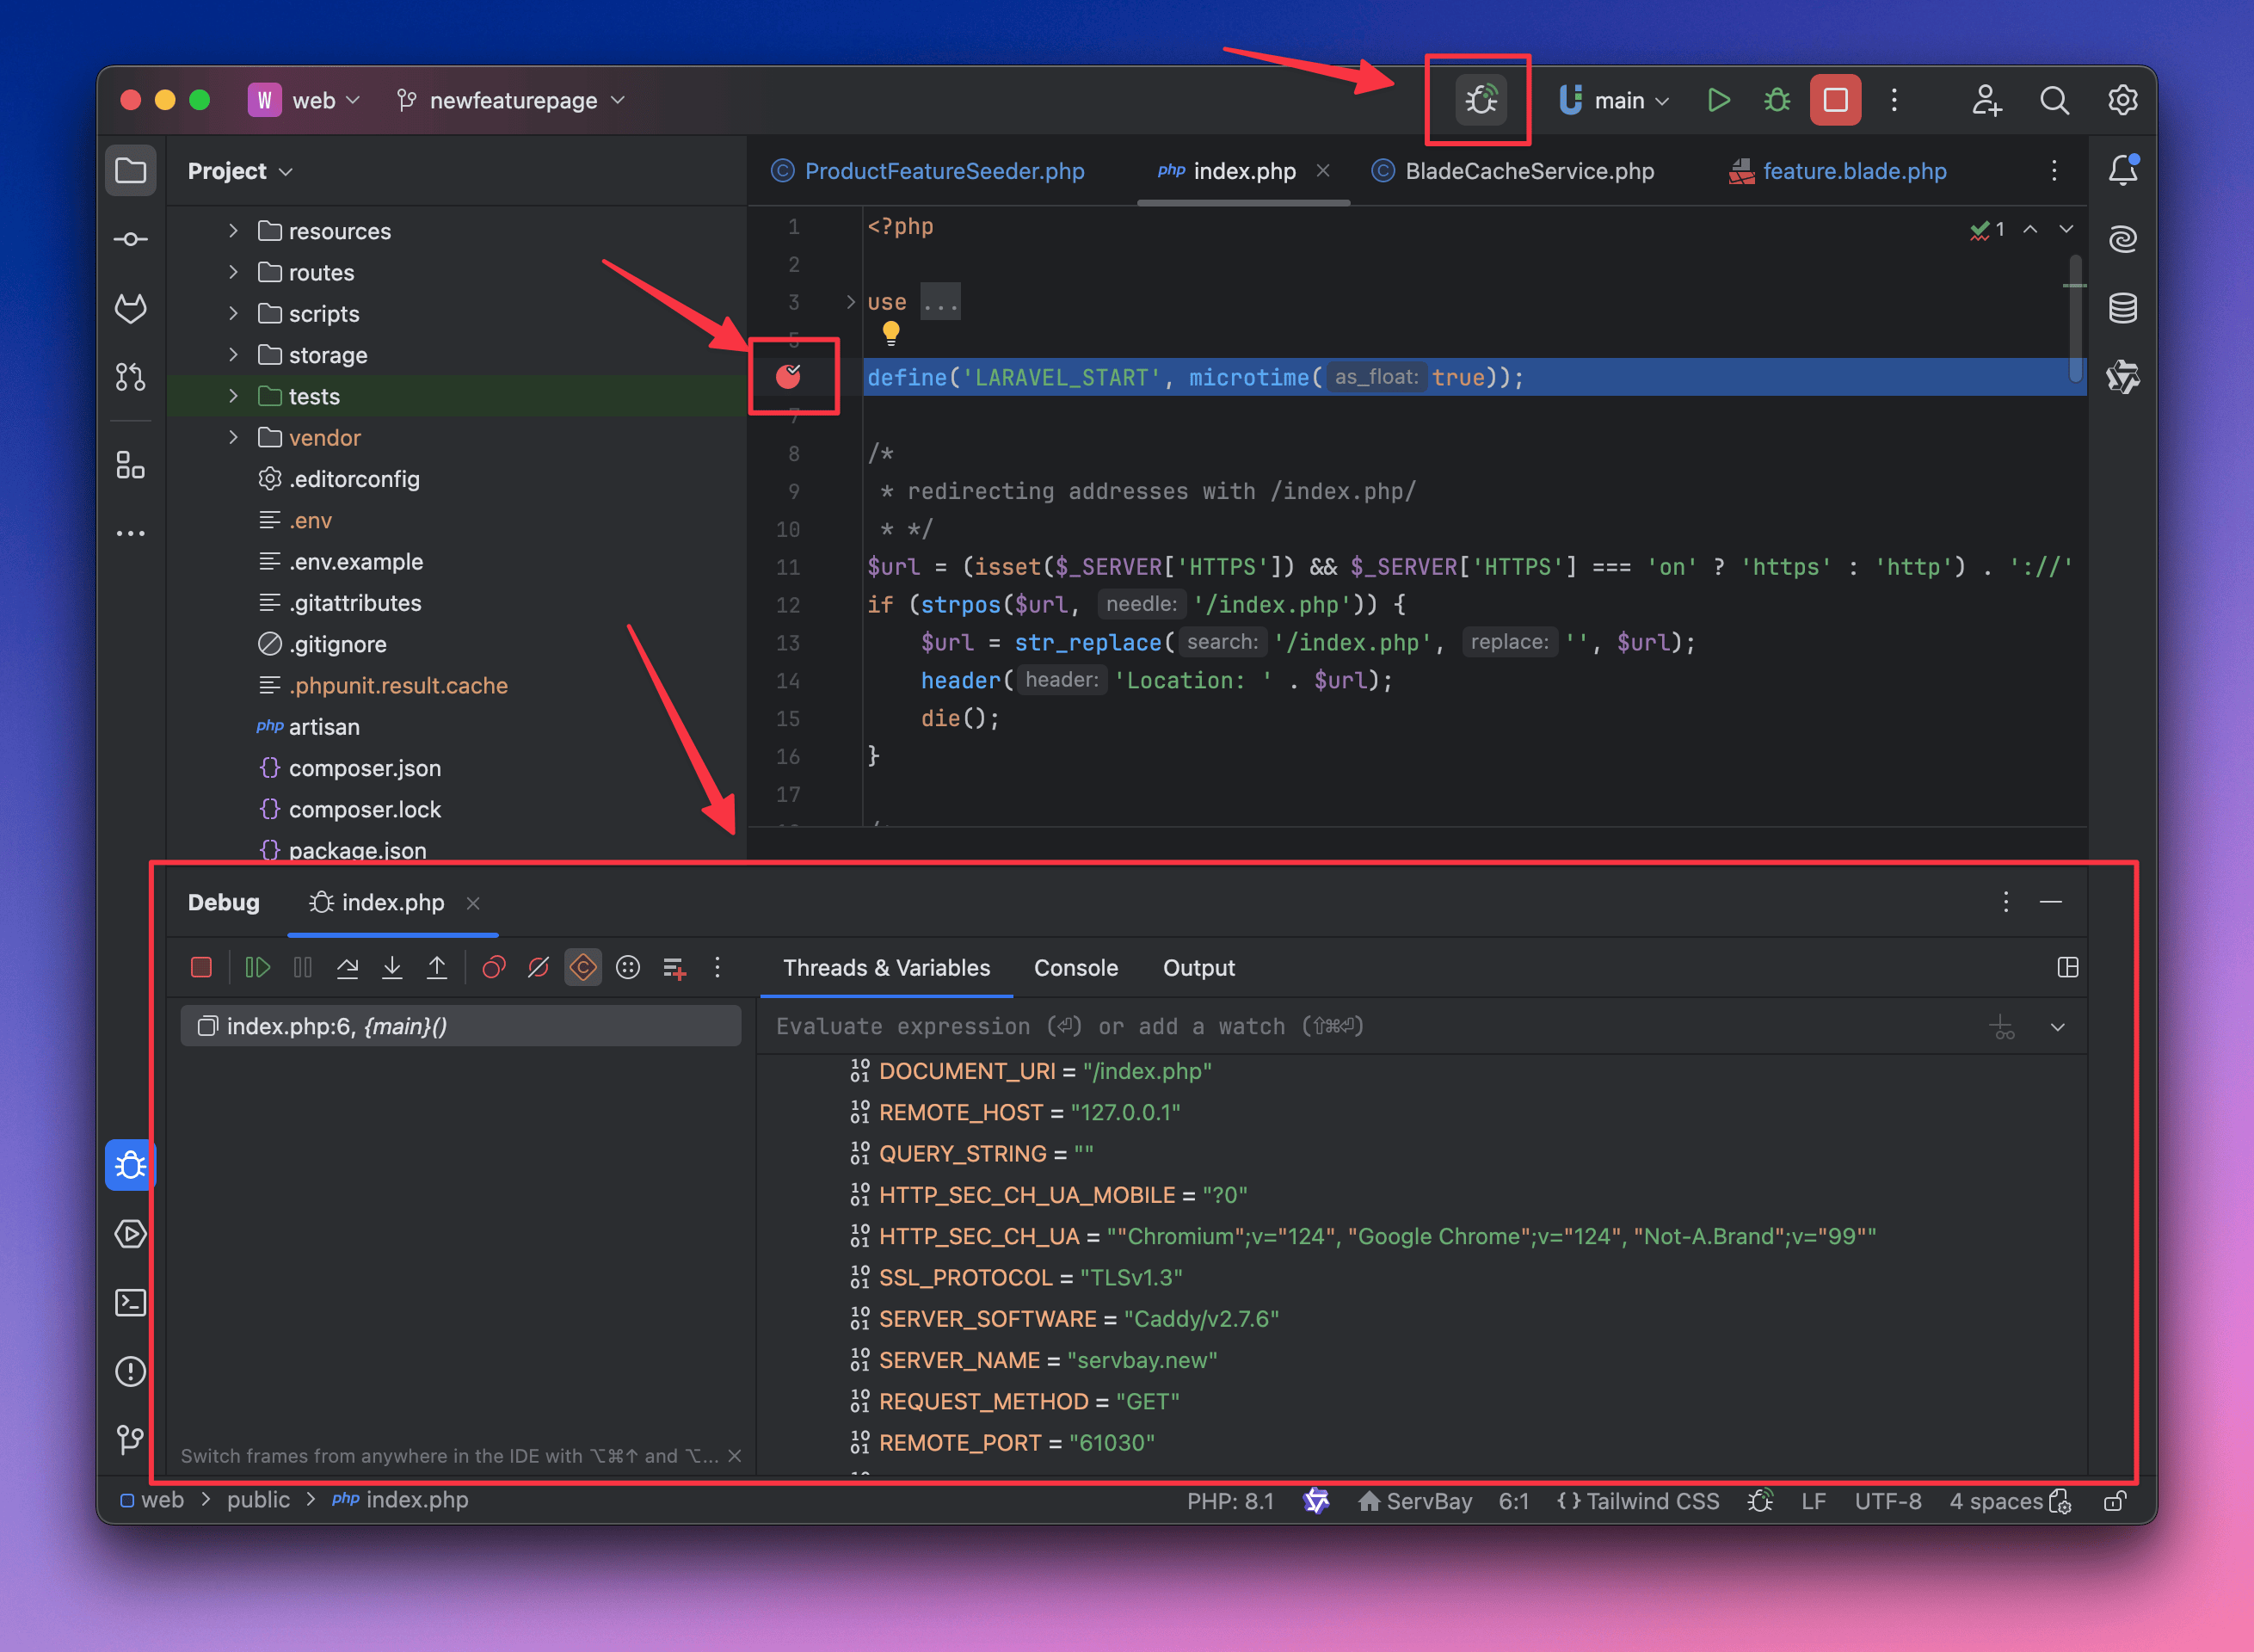 Illustration: Setting up server and path mapping in PHPStorm
- Navigate to
Start a Debugging Session:
- Open the PHP project file you wish to debug.
- Click to the left of a line number to set a breakpoint (red dot).
- Click the
Start Listening for PHP Debug Connectionsbutton (bug icon) in the PHPStorm toolbar. The icon will turn green, indicating PHPStorm is listening for Xdebug connections. - Visit your PHP application in the browser (e.g.,
https://servbay.demo/index.php). - If everything is set up correctly, Xdebug will connect to PHPStorm and pause at your breakpoint, enabling you to debug with full features.
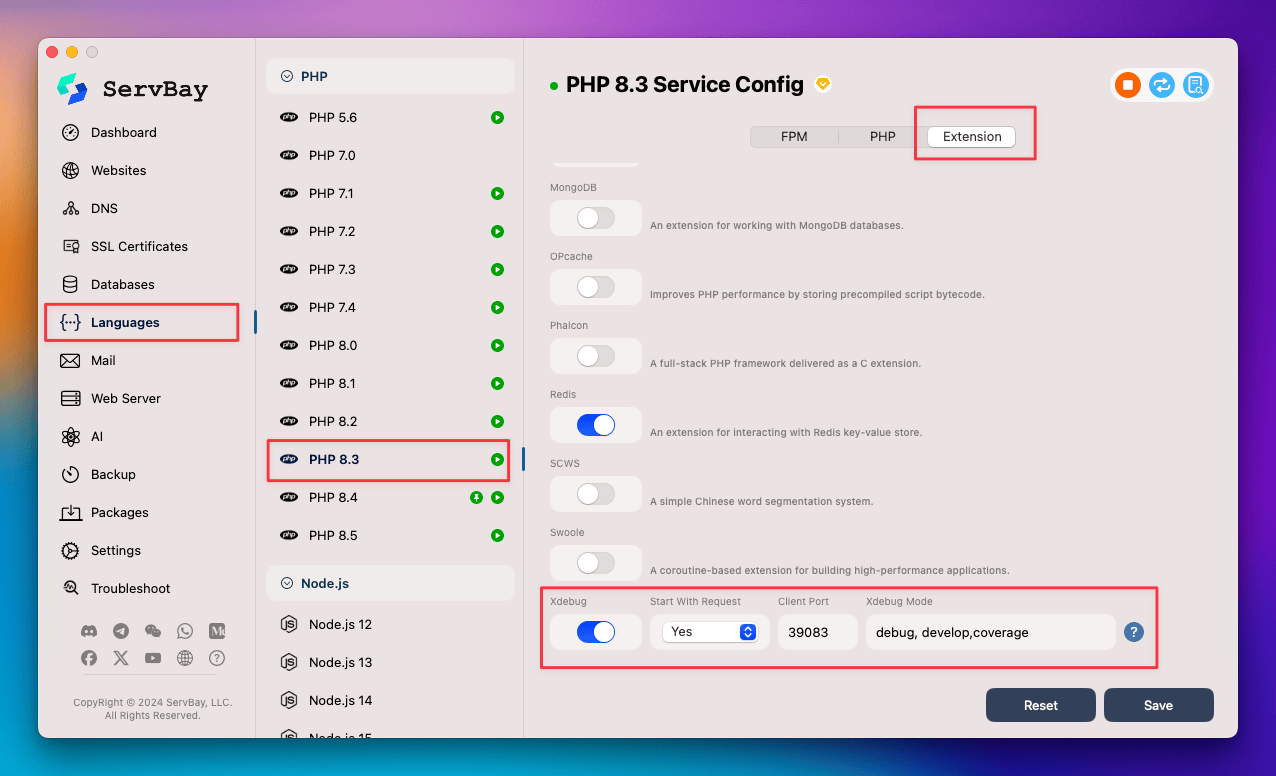 Illustration: Starting Xdebug listen mode in PHPStorm
Setting Up Xdebug in Visual Studio Code (VS Code)
VS Code is another popular code editor, and it can support Xdebug debugging via extensions.
Install the PHP Debug Extension:
- Open VS Code.
- Switch to the Extensions view (
Ctrl+Shift+XorCmd+Shift+X). - Search for "PHP Debug" and install the extension by Felix Becker.
Configure
launch.json:- Open your PHP project folder.
- Go to the Run and Debug view (
Ctrl+Shift+DorCmd+Shift+D). - Click the gear icon in the top toolbar, choose "PHP." This creates a
launch.jsonin your project's.vscodefolder. - Edit
launch.json. Typically, there will be a "Listen for Xdebug" configuration. Make sure theportvalue matches the Xdebug listening port for your PHP version in ServBay (e.g.,39083for PHP 8.3). - Set Up Path Mapping: This is crucial for successful debugging. In
launch.json, add or edit thepathMappingsoption to map your ServBay server project path to your local file system project path.jsonAdjust{ "version": "0.2.0", "configurations": [ { "name": "Listen for Xdebug", "type": "php", "request": "launch", "port": 39083, // Change this port as per your PHP version "pathMappings": { // Map ServBay website root project path to the local file system // For example, if your project is in /Applications/ServBay/www/myproject // and accessed via https://servbay.demo/, then '/' maps to your local root "/": "${workspaceRoot}" // If accessed via https://myproject.servbay.demo/ (subdomain = subdirectory) // then also map '/' to your local root // "/": "${workspaceRoot}" // This works too } }, { "name": "Launch currently open script", "type": "php", "request": "launch", "program": "${file}", "cwd": "${fileDirname}", "port": 39083 // Change this as per your PHP version } ] }pathMappingsaccording to your project structure and ServBay website configuration.${workspaceRoot}usually points to the root of the project folder opened in VS Code.
Start a Debugging Session:
- Open your PHP file in VS Code.
- Click to the left of a line number to set a breakpoint (red dot).
- Go to the Run and Debug view (
Ctrl+Shift+DorCmd+Shift+D). - Select "Listen for Xdebug" (or your custom config) in the debug configuration dropdown.
- Click the green "Start Debugging" button. The VS Code status bar will turn orange, indicating it's listening for Xdebug.
- Visit your PHP application in the browser. If configured properly, Xdebug will connect to VS Code and pause at your breakpoint.
FAQ (Frequently Asked Questions)
Q: Xdebug does not show up in
phpinfo()?- A: Ensure you have enabled Xdebug in the ServBay GUI or manually in
xdebug.ini. - Make sure you have restarted the correct PHP service.
- Check the path to
xdebug.iniis correct and thatzend_extension = xdebug.sois uncommented. - Look at ServBay's log files (
/Applications/ServBay/logs/php/<version>/error.log) for Xdebug loading errors.
- A: Ensure you have enabled Xdebug in the ServBay GUI or manually in
Q: My breakpoints in the IDE are ignored?
- A: Make sure your IDE is set to listen for Xdebug connections (bug icon green in PHPStorm; orange status bar in VS Code).
- Ensure the listening port for Xdebug in your IDE matches the ServBay
xdebug.client_portand the default port for that PHP version. - Verify the path mapping configuration in your IDE; the server file path must correctly map to your local project file. This is the most common source of issues.
- Check your firewall settings—ensure it is not blocking the IDE’s debugger port (usually in the
390xxrange). - If you set
xdebug.start_with_request=triggerin yourxdebug.ini, make sure your browser/request includes a trigger (e.g. the Xdebug Browser Helper, or add?XDEBUG_TRIGGER=1to the URL).
Q: Xdebug disconnects after a while?
- A: Check the settings in
xdebug.ini—ifxdebug.remote_autostartorxdebug.start_with_requestisyes, every request may attempt to start debugging. Thetriggermode is recommended. - Review timeout and debug connection settings in your IDE.
- A: Check the settings in
Conclusion
ServBay significantly lowers the barrier for PHP developers to enable and use Xdebug by pre-integrating the extension and simplifying the configuration process. Whether you're using the intuitive GUI or editing configuration files manually, you can quickly enable Xdebug for any PHP version in ServBay. Combined with advanced debugging features from PHPStorm, VS Code, and other IDEs, you’ll enjoy a powerful, streamlined workflow for PHP code debugging, performance optimization, and quality assurance—boosting your development efficiency. Mastering the synergy between ServBay and Xdebug is truly a game-changer for your local PHP workflow.
