
Viewing Log Files in ServBay: A Guide to Debugging and Troubleshooting
In web development and server management, log files are essential for diagnosing issues, monitoring performance, and understanding application behavior. ServBay, as a powerful local web development environment, integrates a variety of software packages (such as web servers, databases, programming language runtimes, and more) and provides centralized log management for these packages.
This article details the two main ways to view log files in ServBay: via the macOS Terminal and through the ServBay Graphical User Interface (GUI). Mastering these methods will significantly enhance your debugging and troubleshooting efficiency within the ServBay environment.
Target Audience: Web developers using ServBay for local development, working with PHP, Node.js, Python, Go, Java, Ruby, Rust, .NET, databases (MySQL, PostgreSQL, MongoDB, MariaDB), caching services (Redis, Memcached), web servers (Caddy, Nginx, Apache), and other technology stacks.
The Importance of Log Files
Why are log files so important?
- Error Diagnosis: Crashes, configuration errors, permission issues, and more typically leave detailed error information in log files.
- Behavior Analysis: Understanding user requests, server responses, and database queries helps optimize performance and identify abnormal patterns.
- Security Auditing: Logs can record potential security events or unauthorized access attempts.
- Performance Monitoring: Some logs track request processing times, resource usage, and other performance-related data.
ServBay centralizes all package logs for unified and convenient viewing by developers.
Where Are ServBay Log Files Stored?
All ServBay log files are stored in a unified directory:
/Applications/ServBay/logsThis directory contains log files for ServBay itself and all installed and running packages (such as PHP, Caddy, Nginx, MySQL, PostgreSQL, Redis, etc.), usually organized into subdirectories by package type or version.
Method 1: Accessing Log Files via macOS Terminal
For developers comfortable with the command line, accessing log files directly through Terminal provides great flexibility and powerful text processing options (such as filtering with grep or real-time monitoring with tail -f).
1. Open the Terminal App
Launch the "Terminal" application in macOS.
2. Navigate to the ServBay Log Directory
Use the cd command to switch to ServBay’s log directory:
bash
cd /Applications/ServBay/logs3. List Log Files and Directory Structure
In the log directory, use the ls command to see all available log files and subdirectories:
bash
ls -lYou'll see a structure similar to the following (actual contents depend on the packages you have installed and are running):
caddy/
dnsmasq.log
mailpit.log
mariadb/
memcached.log
mongodb/
mysql/
nginx/
apache/
php/
|____5.6/
|____7.0/
|____7.1/
|____7.2/
|____7.3/
|____7.4/
|____8.0/
|____8.1/
|____8.2/
|____8.3/
|____8.4/
postgresql/
redis.log
xdebug/
|____5.6/
|____7.0/
|____7.1/
|____7.2/
|____7.3/
|____7.4/
|____8.0/
|____8.1/
|____8.2/
|____8.3/
|____8.4/4. Viewing Specific Log Files
You can use standard command-line tools (cat, less, tail) to view the contents of log files.
cat <filename>: Displays the entire file at once (best for small files).less <filename>: Paginated viewing, with search and scroll (good for large files).tail -f <filename>: Shows the latest file contents in real time—very useful for monitoring errors or events as they occur during debugging.
Examples:
View PHP 8.3 FPM logs:
bashcat php/8.3/php-fpm.log # Or paginate through the log less php/8.3/php-fpm.log # Or monitor new log entries in real time tail -f php/8.3/php-fpm.logView Caddy web server error logs: Caddy's logs are typically in the
caddysubdirectory. Enter the directory first, then check the log files.bashcd caddy ls # View the log file names, such as error.log tail -f error.logView Nginx web server error logs: Nginx logs are typically in the
nginxsubdirectory.bashcd nginx ls # View the log file names, such as error.log, access.log tail -f error.logView MySQL 8 logs: MySQL logs are typically in the
mysqlsubdirectory.bashcd mysql ls # View the log file names, such as error.log, slow.log tail -f error.logView PostgreSQL logs: PostgreSQL logs are typically in the
postgresqlsubdirectory.bashcd postgresql ls # View the log file names tail -f postgresql.logView Redis logs:
bashtail -f redis.log
5. Using grep to Filter Log Files
When log files are large, the grep command is invaluable for searching for specific information.
Examples:
Find all lines containing "error" in the PHP 8.3 log:
bashgrep "error" php/8.3/php-fpm.logSearch for error messages about a specific request in the Caddy error log:
bashtail -f caddy/error.log | grep "servbay.demo"
By combining tail -f with grep, you can efficiently monitor and filter log entries in real time for exactly what you care about.
Method 2: Viewing Logs Through the ServBay GUI
For developers who prefer not to use the command line, ServBay's GUI offers a convenient way to view logs for specific packages or websites.
1. Open the ServBay Application
Find the ServBay icon in your macOS "Applications" folder and double-click to launch the app.
2. Accessing Logs via the GUI
ServBay provides quick log access panels in several places throughout its interface:
From the "Dashboard" Panel
When you open ServBay, it defaults to the "Dashboard" panel. In the "Quick Service Management" section, there's a log icon (which looks like a document or file) next to each installed or running package. Clicking this icon immediately opens that package's log file.
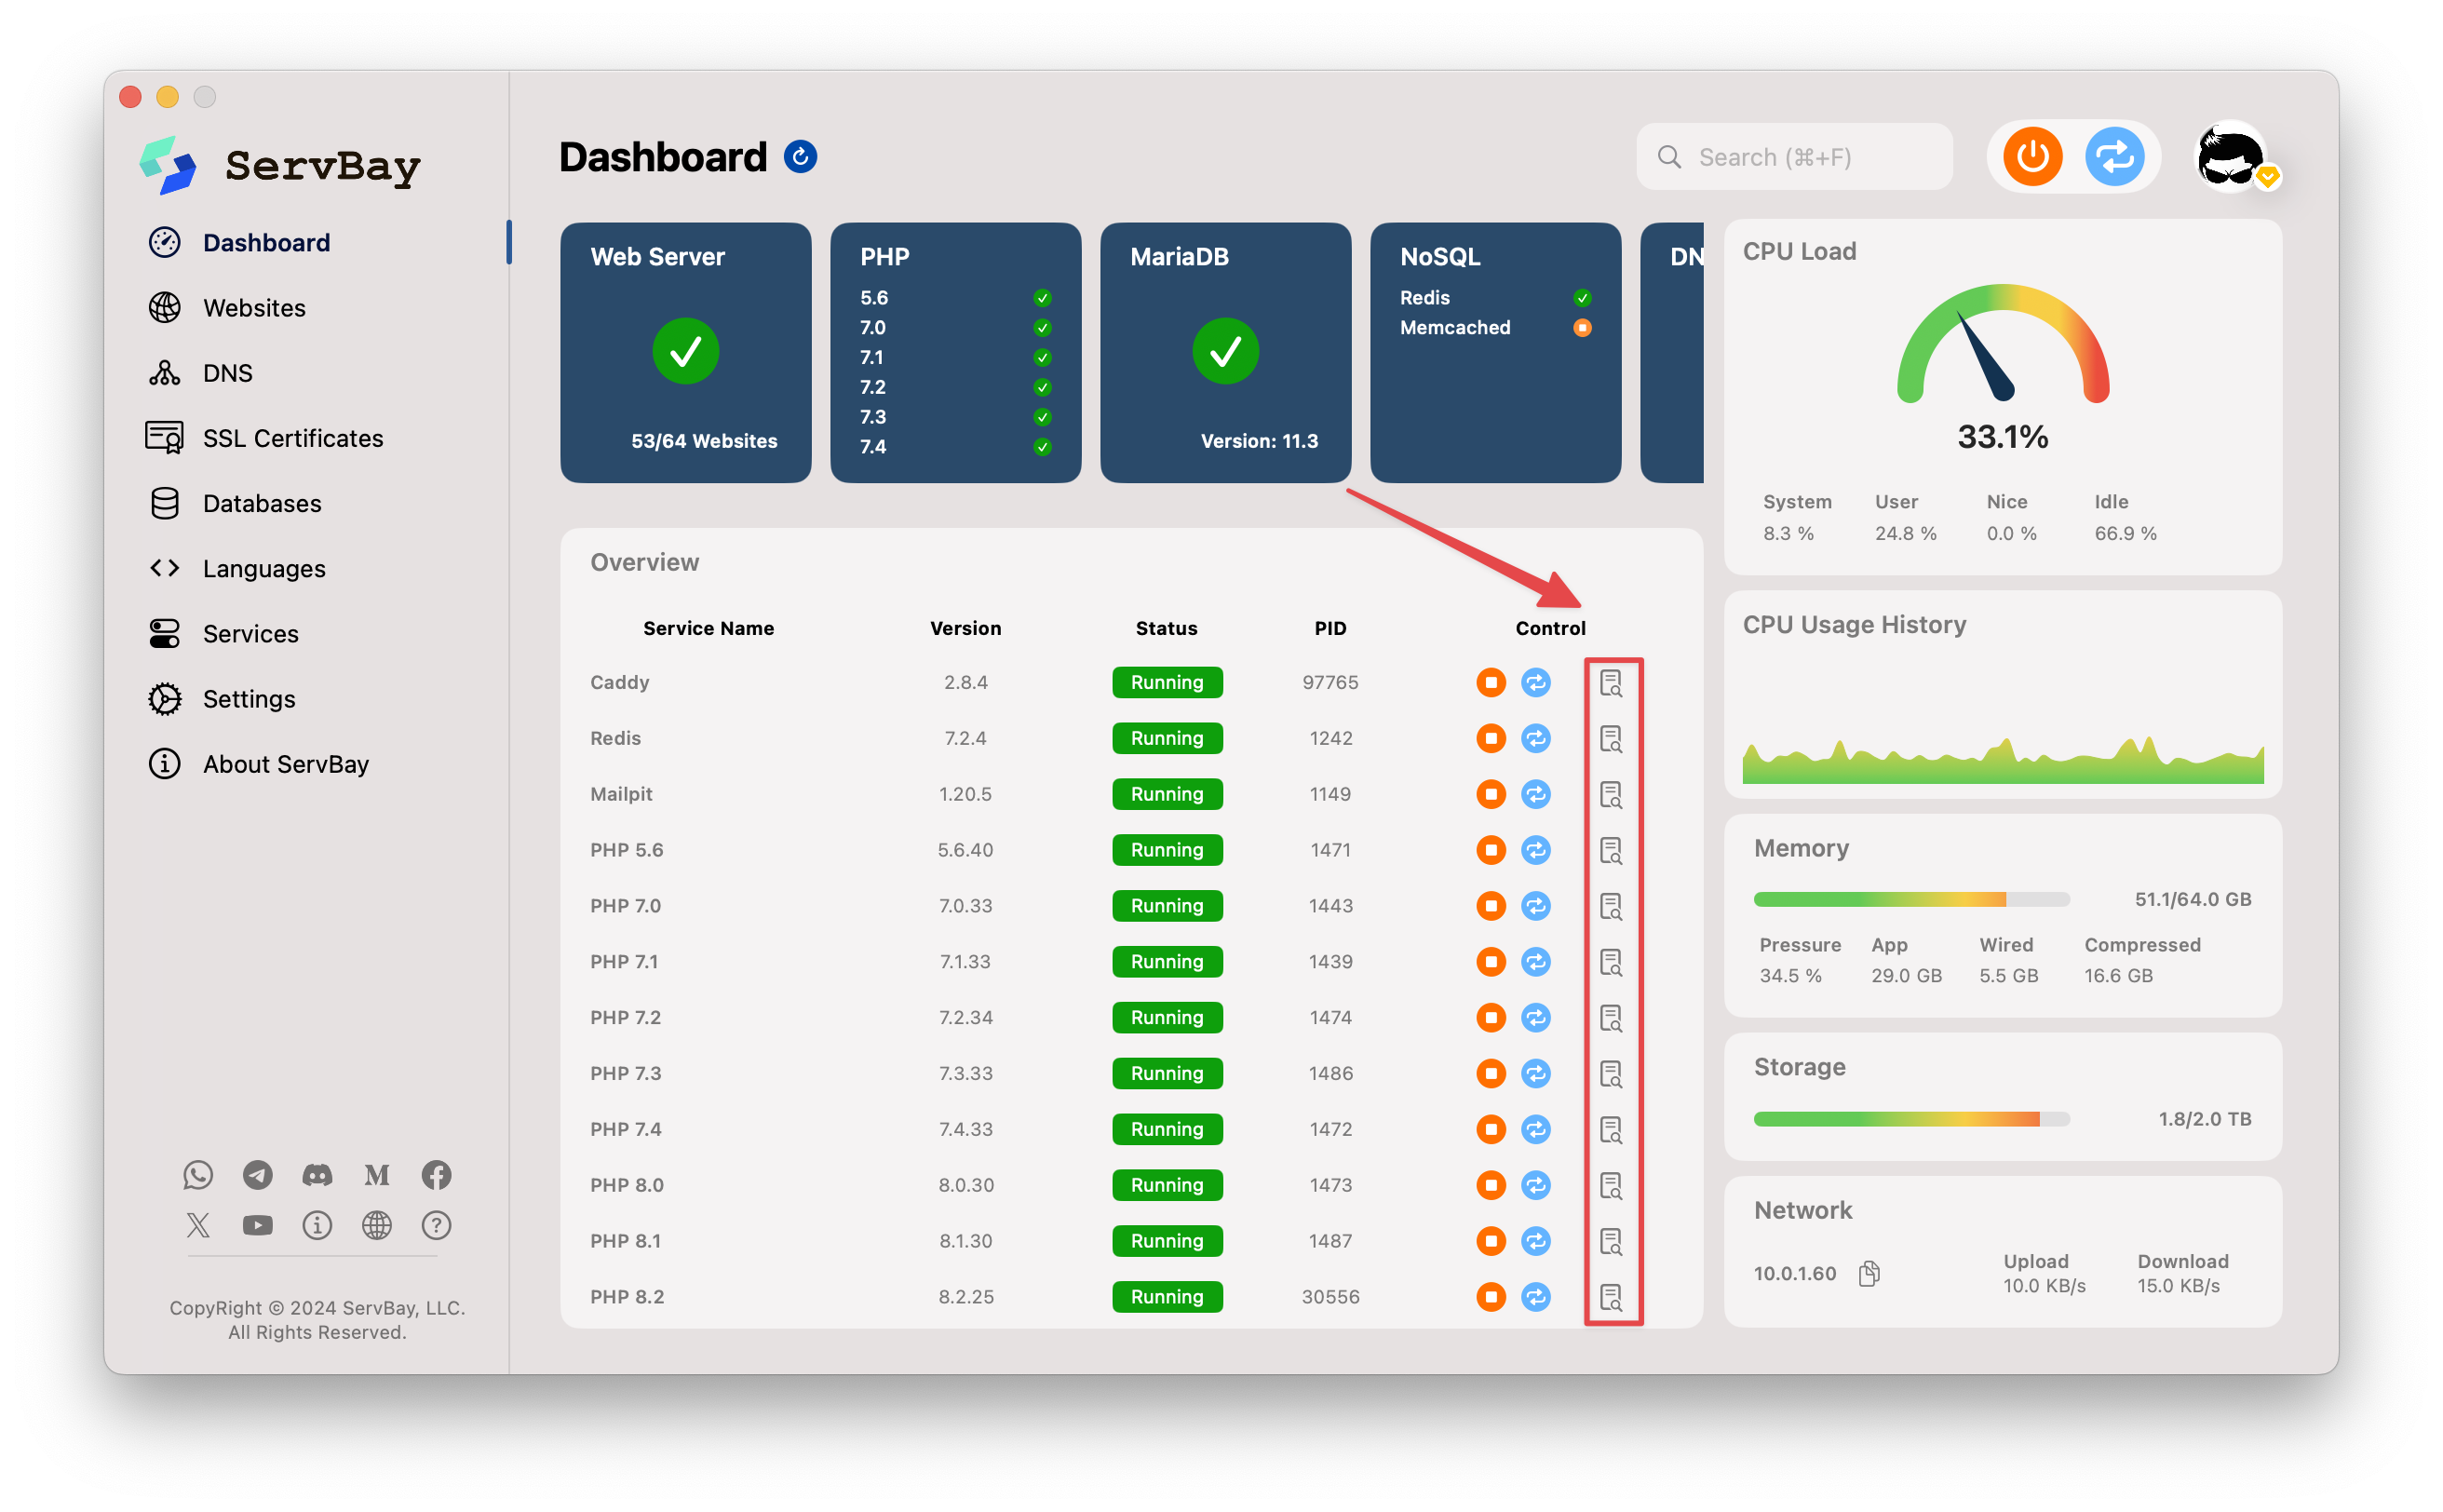 Illustration: Quickly view logs from the dashboard panel
From the "Packages" Panel
- In the ServBay GUI, navigate to the "Packages" panel from the left sidebar.
- On the package listing page, you'll also see a log icon next to each package. Click the icon to view logs for the selected package.
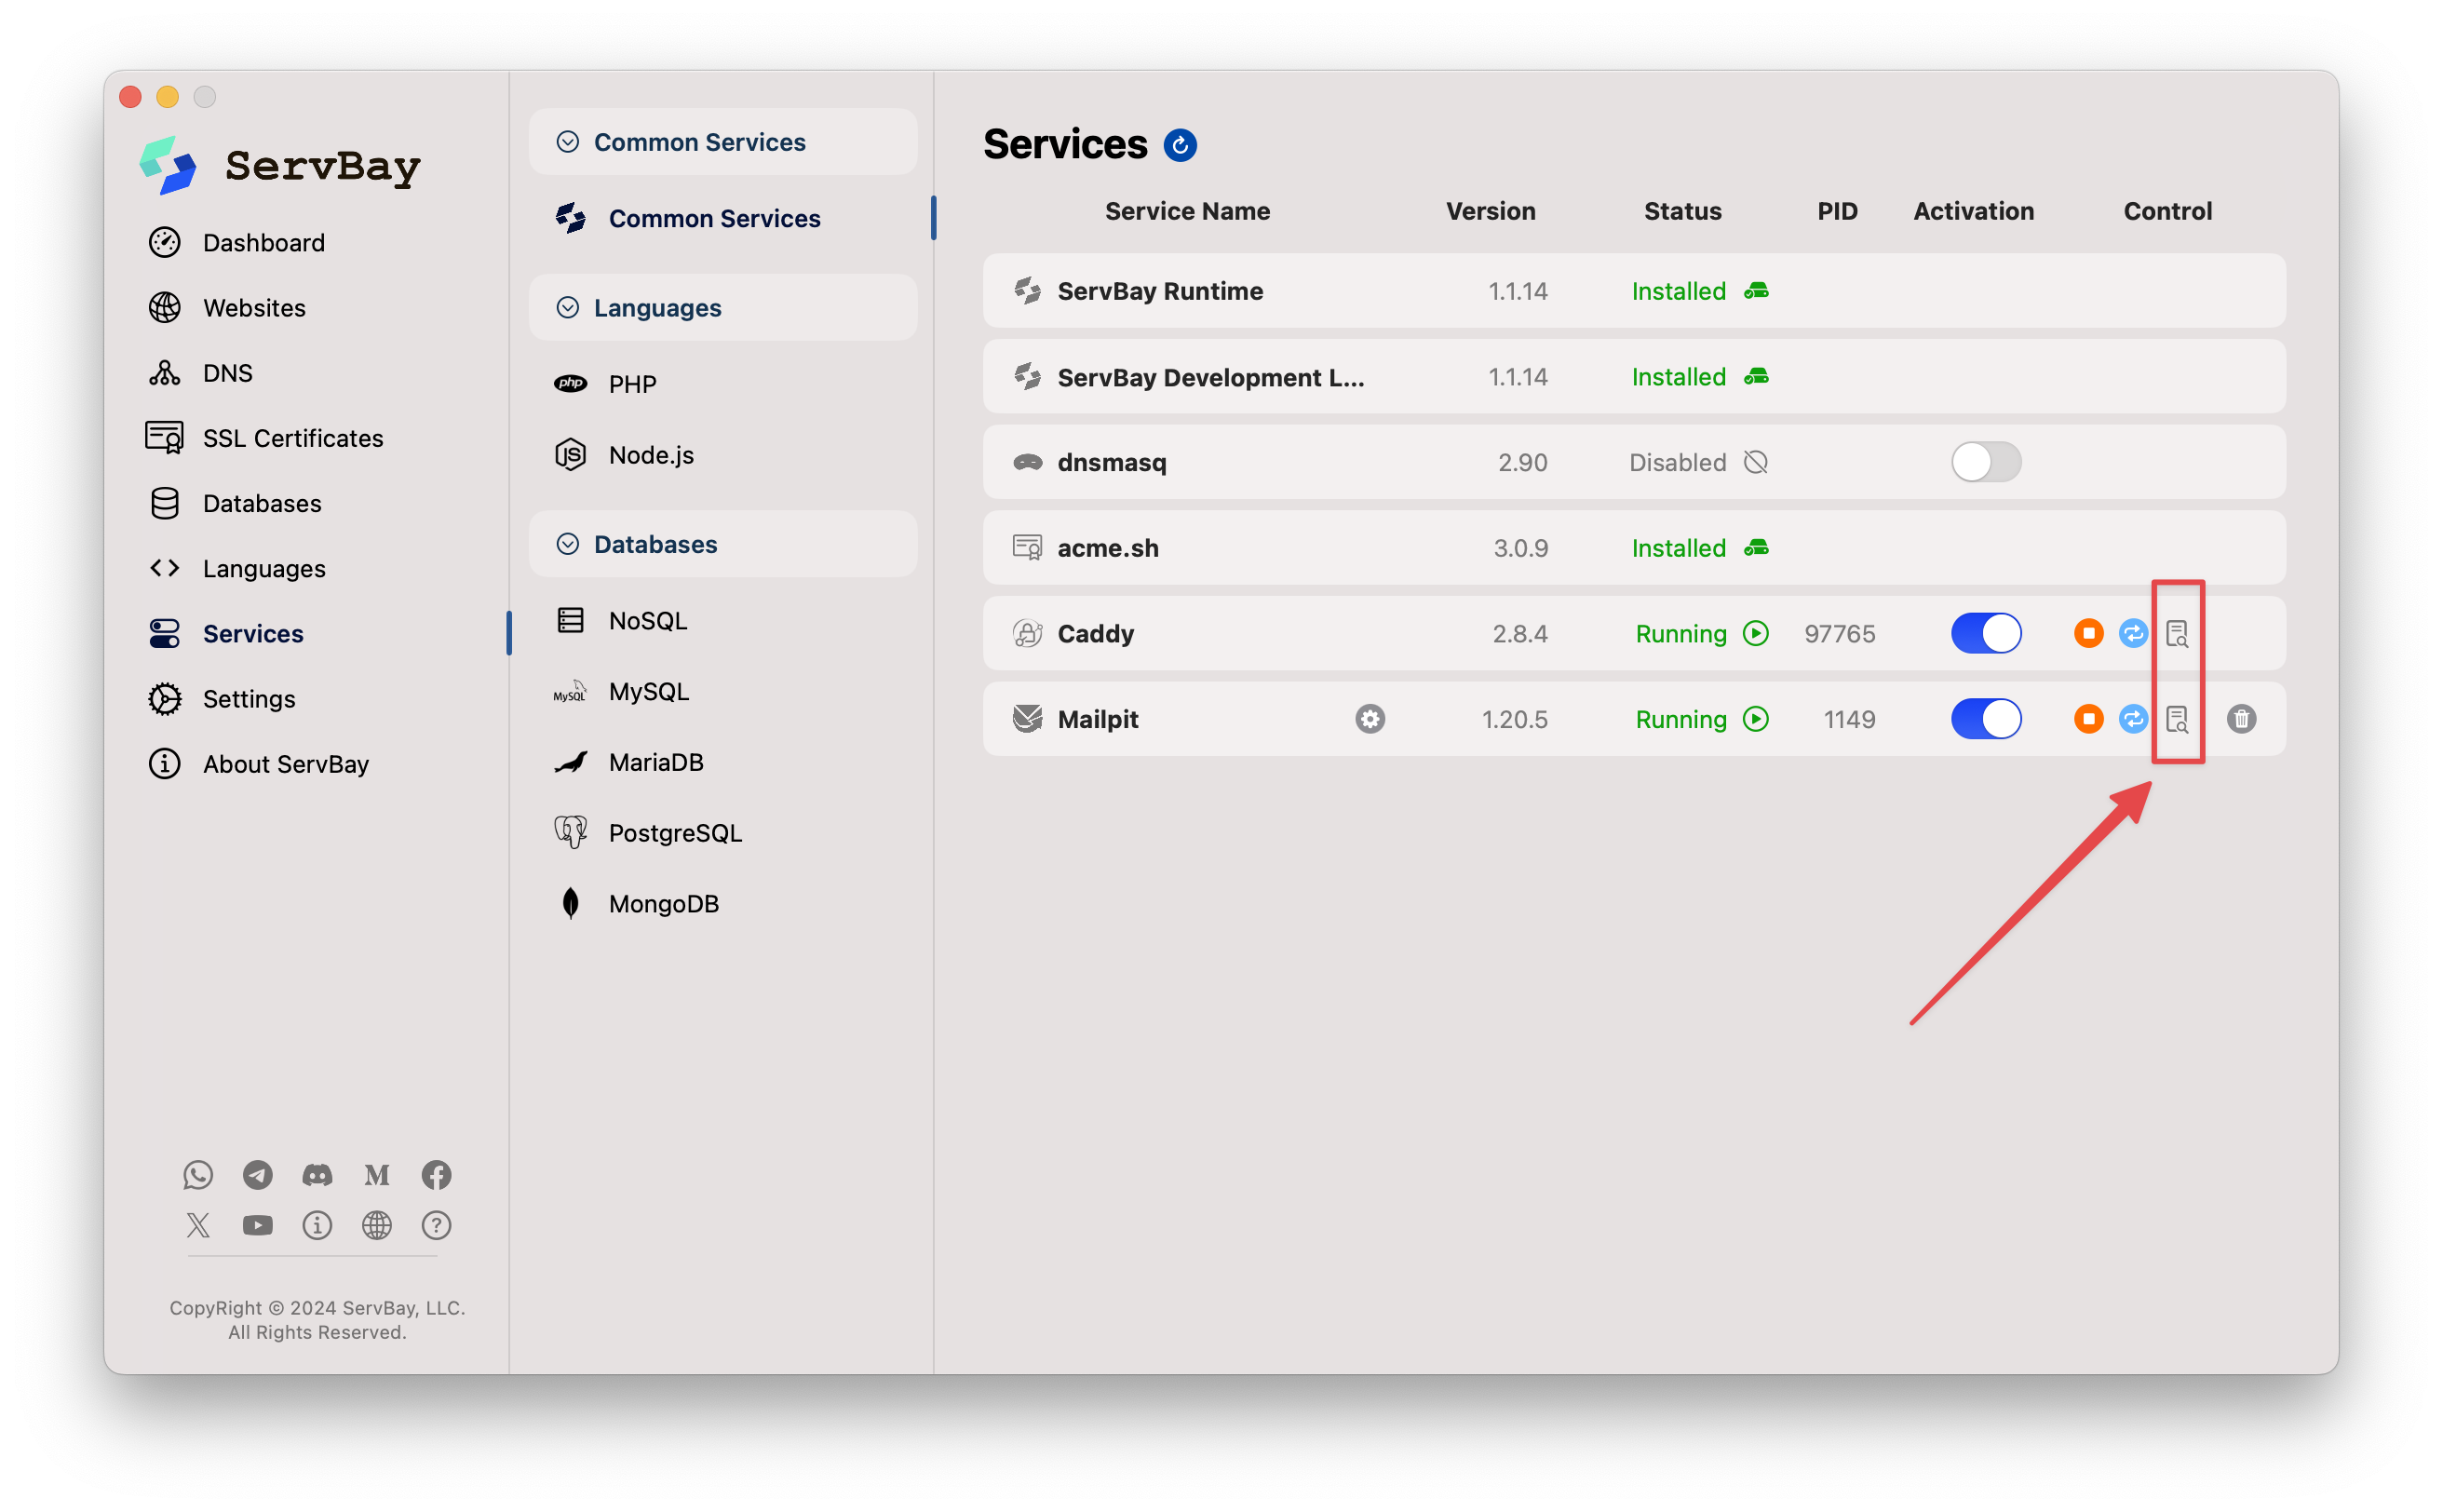 Illustration: View logs from the Packages panel
From the "Websites" Panel
- In the ServBay GUI, navigate to the "Websites" panel from the left sidebar.
- On the website listings, each site's configuration has a log icon on the right. Clicking this icon usually opens the web server (Caddy, Nginx, Apache) access or error logs associated with that site—especially useful for troubleshooting website-specific issues.
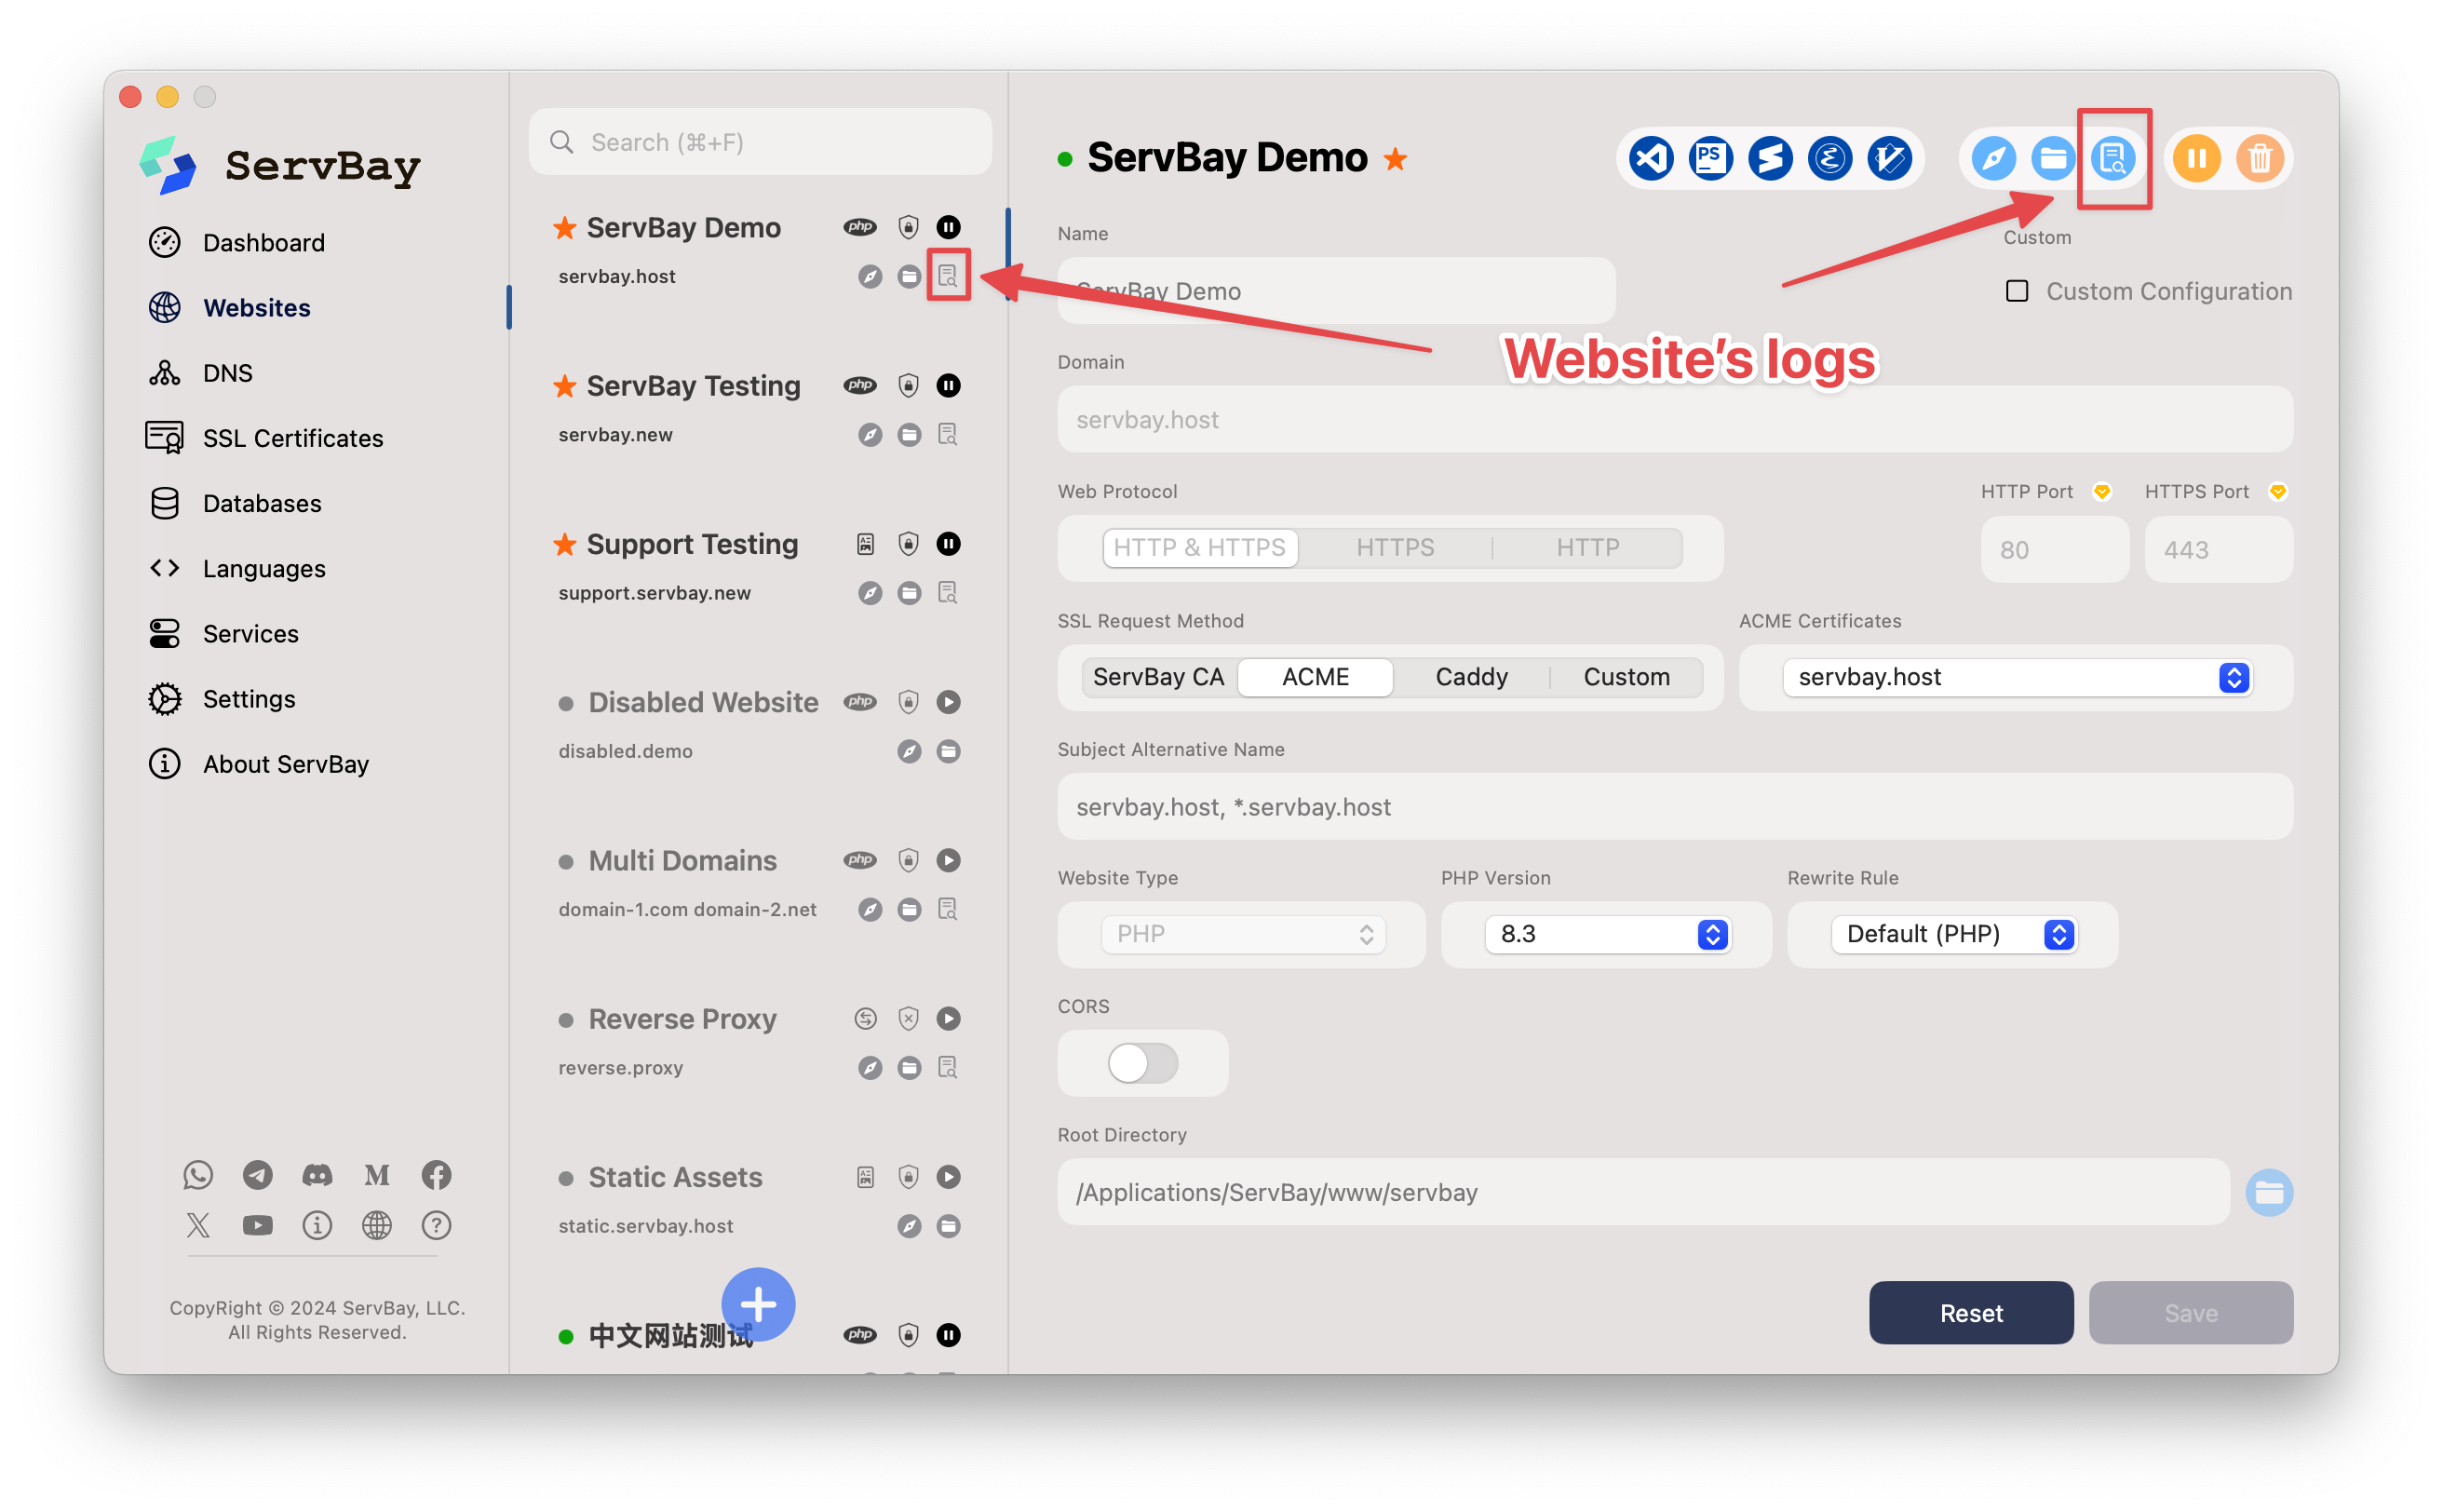 Illustration: View website-related logs from the Websites panel
From the "Package Configs" Panel
- In the ServBay GUI, navigate to the "Package Configs" panel from the left sidebar.
- Select the package you want to configure (e.g., PHP 8.3). In the configuration details page, you'll typically find a log icon at the top right. Click it to open logs for that specific package version.
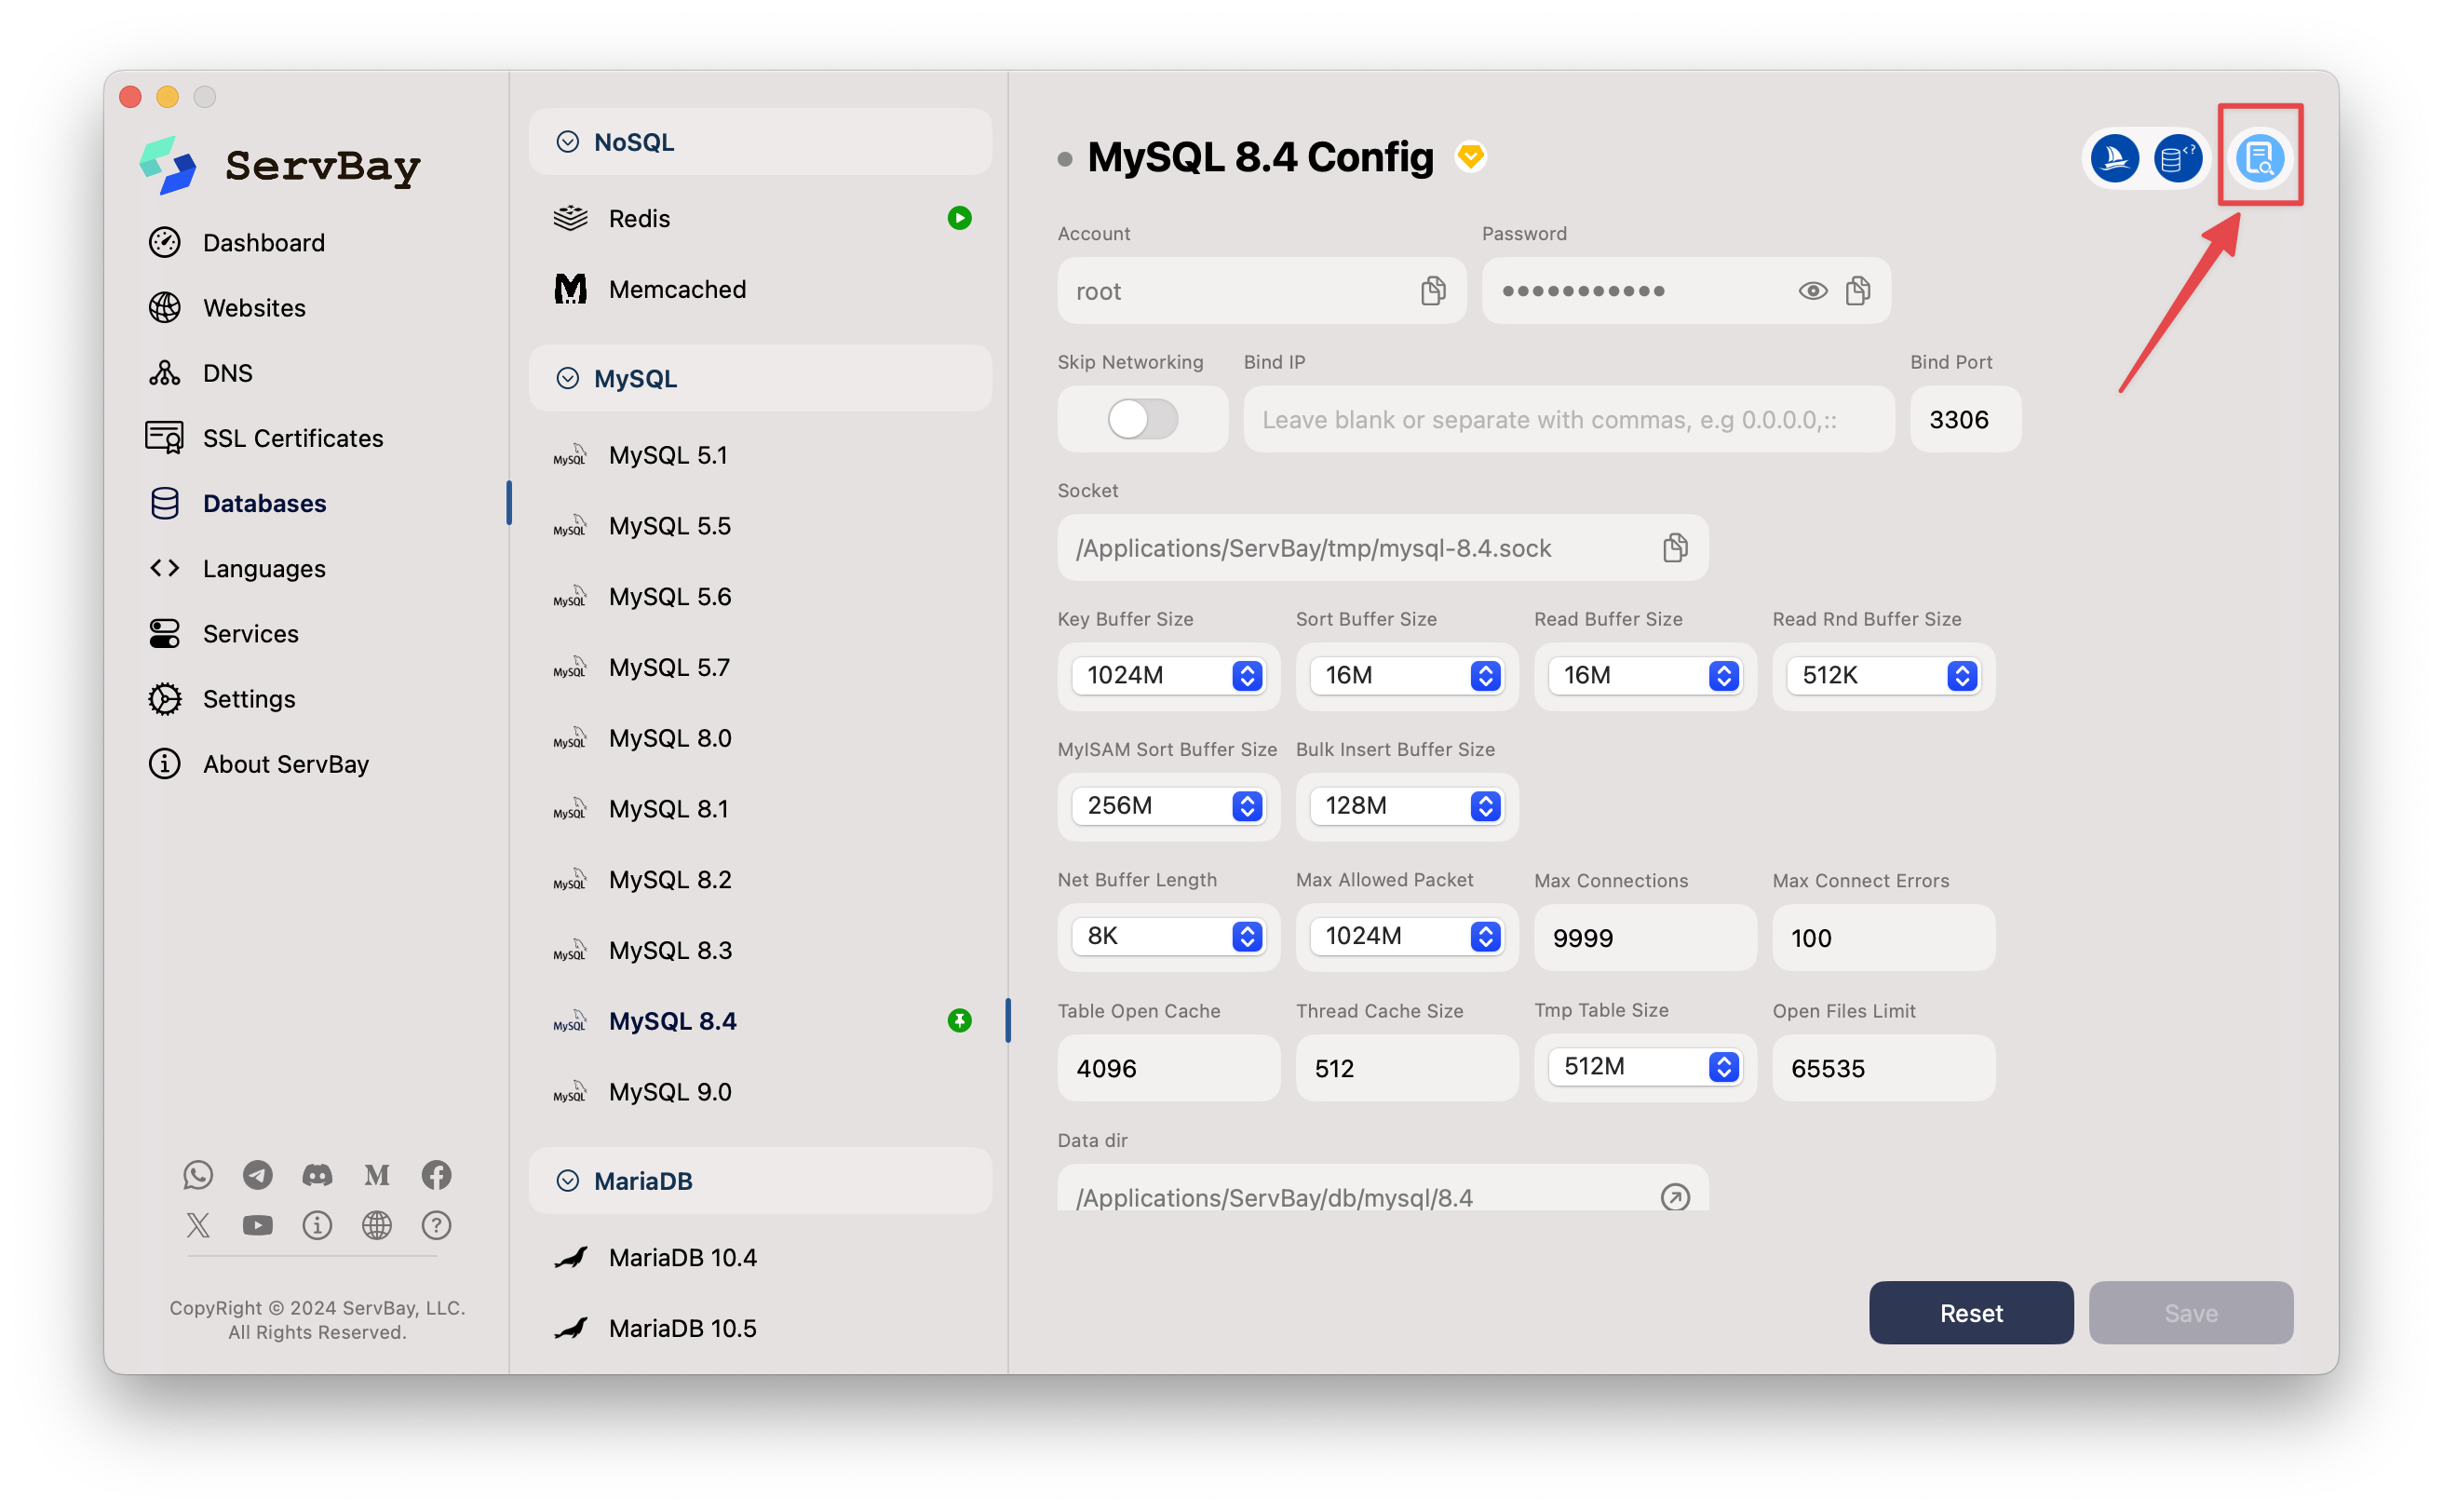 Illustration: View logs from the Package Configs panel
The GUI’s major advantage is its intuitive, quick access—no need to remember file paths or commands. It’s ideal for checking the current status or reviewing recent errors at a glance.
Common ServBay Log Files and Their Functions
Understanding what each log file does helps you pinpoint issues faster:
/Applications/ServBay/logs/caddy/: Contains Caddy web server logs, usually withaccess.log(all incoming requests) anderror.log(server errors)./Applications/ServBay/logs/nginx/: Contains Nginx web server logs, usuallyaccess.loganderror.log./Applications/ServBay/logs/apache/: Contains Apache web server logs, usuallyaccess.loganderror.log./Applications/ServBay/logs/php/<version>/php-fpm.log: Tracks PHP-FPM process manager status, startup errors, and errors generated while running PHP scripts (if PHP error logging is configured here)./Applications/ServBay/logs/mysql/error.log: Contains MySQL server startup, shutdown, runtime errors, warnings, and crash information./Applications/ServBay/logs/mysql/slow.log: Tracks SQL queries that exceed a certain execution threshold (if enabled)./Applications/ServBay/logs/mariadb/error.log: MariaDB server errors and status info, similar to MySQL./Applications/ServBay/logs/postgresql/postgresql.log: Tracks PostgreSQL server events—connections, query errors, configuration issues, and more./Applications/ServBay/logs/mongodb/mongodb.log: MongoDB database startup, connections, replication, sharding, runtime errors, etc./Applications/ServBay/logs/redis.log: Redis key-value store startup, config load, persistence, runtime errors, and more./Applications/ServBay/logs/memcached.log: Memcached cache server startup and runtime information./Applications/ServBay/logs/mailpit.log: Mailpit mail catcher tool status and received email information./Applications/ServBay/logs/xdebug/<version>/: Contains XDebug debugger logs, recording debug session info (if enabled)./Applications/ServBay/logs/dnsmasq.log: Logs queries and resolutions from ServBay’s built-in DNS service (Dnsmasq), useful for troubleshooting local domain resolution.
Log File Management and Cleanup
Log files grow over time and may eventually consume significant disk space. It’s recommended to regularly check file sizes and clear or archive logs when needed.
You can use Terminal commands to delete old log files you no longer need. For example, to remove a specific PHP error log:
bash
rm /Applications/ServBay/logs/php/7.4/php-fpm.logImportant Notes:
- Before deleting any log file, make sure you no longer need the information it contains, or have created a backup.
- Deleting a log file currently in use may prevent a running process from writing logs and could even cause service issues. It’s best to stop the relevant service first, or use a log rotation tool (some ServBay packages come with log rotation configured).
Conclusion
Viewing and analyzing log files is an essential skill in local development environments. ServBay simplifies this process by offering a unified directory structure for logs and a user-friendly GUI for easy access. Whether you prefer the flexibility and power of the command line or the intuitive convenience of the GUI, ServBay provides efficient ways to access logs. Regularly checking critical service logs will help you diagnose issues quickly and maintain a stable, reliable local development environment.
